Brick home offering a great investment opportunity. Tenant-occupied with rental income of $1,350/month. Property features 3 bedrooms, 1 bathroom, and a basement. Do not disturb tenant. Showings and inspections will be scheduled only upon accepted offer. BATVAI.
Active
$99,900
15375 Asbury Park, Detroit, MI 48227
3beds
1,123sqft
Single Family Residence
Built in 1940
3,484 Square Feet Lot
$-- Zestimate®
$89/sqft
$-- HOA
What's special
- 5 days
- 274
- 19
Zillow last checked:
Listing updated:
Listed by:
Kristian Freiwald 313-626-5996,
Domus Realty 313-626-5996
Source: MichRIC,MLS#: 26055080
Facts & features
Interior
Bedrooms & bathrooms
- Bedrooms: 3
- Bathrooms: 1
- Full bathrooms: 1
- Main level bedrooms: 2
Heating
- Forced Air
Appliances
- Laundry: In Basement
Features
- Basement: Full
- Number of fireplaces: 1
Interior area
- Total structure area: 1,123
- Total interior livable area: 1,123 sqft
- Finished area below ground: 0
Property
Features
- Stories: 2
Lot
- Size: 3,484 Square Feet
- Dimensions: 35 x 107
Details
- Parcel number: 22061976.
Construction
Type & style
- Home type: SingleFamily
- Architectural style: Tudor
- Property subtype: Single Family Residence
Materials
- Brick
Condition
- New construction: No
- Year built: 1940
Utilities & green energy
- Sewer: Public Sewer
- Water: Public
Community & HOA
Location
- Region: Detroit
Financial & listing details
- Price per square foot: $89/sqft
- Tax assessed value: $45,085
- Annual tax amount: $1,452
- Date on market: 10/15/2026
- Listing terms: Other,Cash,FHA,VA Loan,Conventional
Estimated market value
Not available
Estimated sales range
Not available
$1,287/mo
Price history
| Date | Event | Price |
|---|---|---|
| 10/15/2026 | Listed for sale | $99,900+17.7%$89/sqft |
Source:  MichRIC #26055080 Report a problem | ||
| 10/6/2026 | Listing removed | $1,350$1/sqft |
Source: Zillow Rentals Report a problem | ||
| 9/24/2026 | Listed for rent | $1,350$1/sqft |
Source: Zillow Rentals Report a problem | ||
| 9/24/2026 | Listing removed | $1,350$1/sqft |
Source: Zillow Rentals Report a problem | ||
| 9/4/2026 | Listed for rent | $1,350+8%$1/sqft |
Source: Zillow Rentals Report a problem | ||
| 7/22/2026 | Listing removed | $84,900$76/sqft |
Source: MichRIC #26011065 Report a problem | ||
| 7/1/2026 | Price change | $84,900-5.7%$76/sqft |
Source: MichRIC #26011065 Report a problem | ||
| 4/22/2026 | Listed for sale | $90,000$80/sqft |
Source: MichRIC #26011065 Report a problem | ||
| 4/14/2026 | Contingent | $90,000$80/sqft |
Source: MichRIC #26011065 Report a problem | ||
| 3/21/2026 | Listed for sale | $90,000-1.1%$80/sqft |
Source: MichRIC #26011065 Report a problem | ||
| 3/4/2024 | Sold | $91,000+106.8%$81/sqft |
Source: Public Record Report a problem | ||
| 1/24/2024 | Listing removed | -- |
Source: Zillow Rentals Report a problem | ||
| 12/30/2023 | Listed for rent | $1,250$1/sqft |
Source: Zillow Rentals Report a problem | ||
| 12/29/2023 | Listing removed | -- |
Source: Zillow Rentals Report a problem | ||
| 12/21/2023 | Price change | $1,250+19%$1/sqft |
Source: Zillow Rentals Report a problem | ||
| 12/8/2023 | Listed for rent | $1,050-12.1%$1/sqft |
Source: Zillow Rentals Report a problem | ||
| 9/30/2023 | Sold | $44,000-58.9%$39/sqft |
Source:  Realcomp II #20230083418 Report a problem | ||
| 12/30/2022 | Listing removed | -- |
Source: Realcomp II #20221026418 Report a problem | ||
| 11/16/2022 | Listed for sale | $107,000$95/sqft |
Source: Realcomp II #20221026418 Report a problem | ||
| 10/21/2022 | Listing removed | -- |
Source: Zillow Rental Network Premium Report a problem | ||
| 10/11/2022 | Listed for rent | $1,195$1/sqft |
Source: Zillow Rental Network Premium Report a problem | ||
| 8/31/2022 | Listing removed | -- |
Source: Realcomp II #20221026418 Report a problem | ||
| 8/2/2022 | Listed for sale | $107,000-7%$95/sqft |
Source: Realcomp II #20221026418 Report a problem | ||
| 7/1/2022 | Listing removed | -- |
Source: Realcomp II #2220007509 Report a problem | ||
| 6/20/2022 | Listed for sale | $115,000$102/sqft |
Source: Realcomp II #2220007509 Report a problem | ||
| 4/12/2022 | Listing removed | -- |
Source: Realcomp II #2220007509 Report a problem | ||
| 4/4/2022 | Pending sale | $115,000+91.7%$102/sqft |
Source: Realcomp II #2220007509 Report a problem | ||
| 3/30/2018 | Sold | $60,000$53/sqft |
Source: Public Record Report a problem | ||
Public tax history
| Year | Property taxes | Tax assessment |
|---|---|---|
| 2025 | -- | $37,300 +25.6% |
| 2024 | -- | $29,700 +21.2% |
| 2023 | -- | $24,500 +26.9% |
| 2022 | -- | $19,300 +1% |
| 2021 | -- | $19,100 |
| 2020 | $2,316 +81.3% | $19,100 +27.3% |
| 2019 | $1,278 | $15,000 +25% |
| 2018 | $1,278 | $12,000 +1.7% |
| 2017 | -- | $11,800 -30.6% |
| 2016 | $38 | $17,000 |
| 2015 | $38 -98.4% | $17,000 -28.8% |
| 2013 | $2,387 +6115.1% | $23,866 +2875.8% |
| 2010 | $38 | $802 |
| 2009 | -- | $802 -98.4% |
| 2008 | -- | $49,100 |
| 2007 | -- | $49,100 +5.5% |
| 2005 | $358 | $46,540 +3% |
| 2004 | -- | $45,184 +31.7% |
| 2001 | -- | $34,300 +32.5% |
| 2000 | $1,549 | $25,882 |
Find assessor info on the county website
Monthly payment
Est. payment
Payment breakdown
Explore the cost of this home by adjusting the details. Changes won't be saved.Climate risks
Neighborhood: Crary
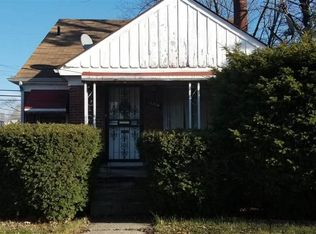
Similar homes
- $89,9003 bd1 ba952 sqft18556 Kentfield St, Detroit, MI 48219For Sale
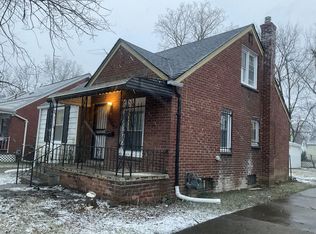
 MLS ID #26054822, Kristian Freiwald, Domus Realty. MichRIC
- $79,9004 bd1 ba1k sqft15420 Sussex St, Detroit, MI 48227For Sale
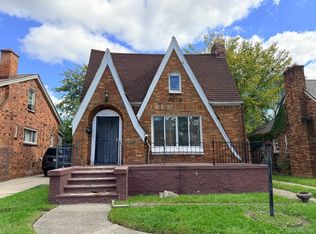
 MLS ID #20261081335, Daniella Mendoza-Herrera, RE/MAX Leading Edge. Realcomp II
- $99,9003 bd2 ba1.2k sqft10526 W Outer Dr, Detroit, MI 48223For Sale
 MLS ID #20261062711, Rerhi Onomake, Community Choice Realty Inc. Realcomp II
- $64,9003 bd1 ba1.2k sqft15411 Ferguson St, Detroit, MI 48227For Sale
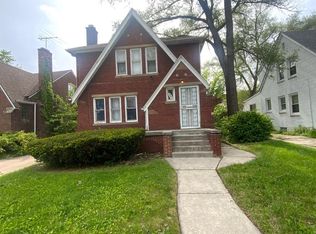 MLS ID #20261080398, Bobby Hesley, REMAX City Centre. Realcomp II
- $125,0003 bd1 ba1.1k sqft10006 Auburn St, Detroit, MI 48228For SaleMLS ID #20261085046, Fay Salmaci, ARG Realty. Realcomp II
- $95,0001 bd1 ba720 sqft11758 Hartwell St, Detroit, MI 48227For SaleMLS ID #26052441, Shelia Williams, Dumas Realty. MichRIC
- $105,0003 bd1 ba1.5k sqft15514 Griggs St, Detroit, MI 48238For SaleMLS ID #20261078770, Jesus Coronado, EXP Realty Main. Realcomp II
- $110,0003 bd2 ba1.4k sqft4331 Fullerton St, Detroit, MI 48238For SaleMLS ID #20261079981, Judy Walker, RPR Real Estate Services. Realcomp II
- $93,0003 bd1 ba1k sqft7811 Ashton Ave, Detroit, MI 48228For SaleMLS ID #26051065, LaKeita Mitchell, Superior Home Realty. MichRIC
- $82,5003 bd1 ba1.4k sqft15055 Mark Twain St, Detroit, MI 48227For SaleMLS ID #26005220, Kristian Freiwald, Domus Realty. MichRIC
- $89,9003 bd1 ba1.4k sqft16536 Cheyenne St, Detroit, MI 48235For SaleMLS ID #20261073756, Leonard A Pickett III, RCH Brokerage Legacy Inc. Realcomp II
- $75,0003 bd1 ba1.1k sqft14466 Robson St, Detroit, MI 48227For SaleMLS ID #20261026582, Jennifer Hemstrom, Thrive Realty Company. Realcomp II
- $69,9003 bd1 ba863 sqft14815 Stansbury St, Detroit, MI 48227For SaleMLS ID #26048930, Kristian Freiwald, Domus Realty. MichRIC
- $109,0003 bd1 ba1.2k sqft16606 Woodingham Dr, Detroit, MI 48221For SaleMLS ID #20261069225, Berkeley Champlin, MI House of Detroit LLC. Realcomp II
- $89,9003 bd2 ba1.5k sqft20426 Tracey St, Detroit, MI 48235For SaleMLS ID #26043501, Kristian Freiwald, Domus Realty. MichRIC
- $94,9003 bd1 ba860 sqft16608 Trinity St, Detroit, MI 48219For SaleMLS ID #26029569, Kristian Freiwald, Domus Realty. MichRIC
- $85,0003 bd1 ba879 sqft19035 Fielding St, Detroit, MI 48219For SaleMLS ID #20261077288, David Rabior, Clyde Realty LLC. Realcomp II
- $77,9003 bd1 ba886 sqft9979 Montrose St, Detroit, MI 48227For SaleMLS ID #20261046299, Greg Majewski, Detroit Investment Company. Realcomp II
- $115,0003 bd2 ba800 sqft17563 S Mansfield St, Detroit, MI 48235For SaleMLS ID #20261067129, Deborah Turner, Red Carpet Keim Classic Realty. Realcomp II
- $85,0003 bd1 ba960 sqft15427 Patton St, Detroit, MI 48223For SaleMLS ID #20261048366, Marnette Watkins Cobb, Cobb Realty Group. Realcomp II
