Turnkey duplex investment in Memphis! Both units were completely renovated before the current tenants moved in, and both are occupied by long-term Section 8 tenants with dependable, government-backed rent. Current rents are $997 and $1,238, for $2,235/month or $26,820/year gross. Nothing to fix and no vacancy to fill, so you collect rent from day one. It’s a great fit for investors who want a hands-off addition to their portfolio. No showings without an accepted offer. Cash or conventional financing only. No seller financing or creative financing.
For sale
$199,900
155 N Merton St, Memphis, TN 38112
4beds
1,725sqft
Duplex
Built in 1947
-- sqft lot
$198,700 Zestimate®
$116/sqft
$-- HOA
What's special
- 1 hour
- 8
- 2
Zillow last checked:
Listing updated:
Listed by:
Caleb Parr,
Renshaw Company, REALTORS 901-820-4367
Source: MAAR,MLS#: 10234081
Facts & features
Interior
Bedrooms & bathrooms
- Bedrooms: 4
- Bathrooms: 2
- Full bathrooms: 2
Heating
- Central, Other (See Remarks)
Cooling
- Central Air, Other (See Remarks)
Features
- Updated/Renovated Kit, Square Feet Source:AutoFill (MAARdata) or Public Records (Cnty Assessor Site)
- Flooring: Vinyl
- Basement: Crawl Space
Interior area
- Total interior livable area: 1,725 sqft
Property
Parking
- Parking features: Other (See REMARKS)
Features
- Stories: 1
- Pool features: None
Lot
- Size: 0.28 Acres
- Dimensions: 75 x 160
- Features: Level
Details
- Parcel number: 033012 00022
Construction
Type & style
- Home type: MultiFamily
- Architectural style: Traditional
- Property subtype: Duplex
Materials
- Brick Veneer
- Roof: Composition Shingles
Condition
- Year built: 1947
Community & HOA
Community
- Subdivision: Barton & Lamb Poplar St Re Of Part Lots
Location
- Region: Memphis
Financial & listing details
- Price per square foot: $116/sqft
- Tax assessed value: $143,100
- Annual tax amount: $3,017
- Date on market: 11/9/2026
- Listing terms: Conventional
- Lease term: 12 Months
Estimated market value
$198,700
$189,000 - $209,000
$968/mo
Price history
| Date | Event | Price |
|---|---|---|
| 11/9/2026 | Listed for sale | $199,900-45.2%$116/sqft |
Source:  MAAR #10234081 Report a problem | ||
| 4/29/2026 | Listing removed | $365,000$212/sqft |
Source: MAAR #10210213 Report a problem | ||
| 11/24/2025 | Pending sale | $365,000$212/sqft |
Source: MAAR #10210213 Report a problem | ||
| 11/21/2025 | Listed for sale | $365,000+25.9%$212/sqft |
Source: MAAR #10210213 Report a problem | ||
| 10/17/2025 | Listing removed | $1,000$1/sqft |
Source: Zillow Rentals Report a problem | ||
| 8/28/2025 | Listed for rent | $1,000-16.7%$1/sqft |
Source: Zillow Rentals Report a problem | ||
| 2/21/2023 | Listing removed | -- |
Source: Owner Report a problem | ||
| 2/16/2023 | Listed for sale | $290,000+90.2%$168/sqft |
Source: Owner Report a problem | ||
| 2/15/2023 | Listing removed | -- |
Source: Zillow Rentals Report a problem | ||
| 2/7/2023 | Listed for rent | $1,200$1/sqft |
Source: Zillow Rentals Report a problem | ||
| 1/31/2023 | Listing removed | -- |
Source: Zillow Rentals Report a problem | ||
| 1/28/2023 | Price change | $1,200-4%$1/sqft |
Source: Zillow Rentals Report a problem | ||
| 1/20/2023 | Price change | $1,250-3.8%$1/sqft |
Source: Zillow Rentals Report a problem | ||
| 1/11/2023 | Listed for rent | $1,300-3.7%$1/sqft |
Source: Zillow Rentals Report a problem | ||
| 1/2/2023 | Listing removed | -- |
Source: Zillow Rentals Report a problem | ||
| 12/15/2022 | Listed for rent | $1,350+126.9%$1/sqft |
Source: Zillow Rentals Report a problem | ||
| 9/6/2022 | Sold | $152,500-1.5%$88/sqft |
Source: MAAR #10129634 Report a problem | ||
| 8/8/2022 | Pending sale | $154,900$90/sqft |
Source: MAAR #10129634 Report a problem | ||
| 7/26/2022 | Listed for sale | $154,900+27%$90/sqft |
Source: MAAR #10129634 Report a problem | ||
| 6/28/2019 | Listing removed | $595 |
Source: Zillow Rental Manager Report a problem | ||
| 6/13/2019 | Listed for rent | $595 |
Source: Zillow Rental Manager Report a problem | ||
| 9/19/2016 | Sold | $122,000+148.1%$71/sqft |
Source: Public Record Report a problem | ||
| 6/20/2014 | Sold | $49,167$29/sqft |
Source: MAAR #3294008 Report a problem | ||
Public tax history
| Year | Property taxes | Tax assessment |
|---|---|---|
| 2025 | $3,017 +216.4% | $57,240 +295.3% |
| 2024 | $954 +8.1% | $14,480 |
| 2023 | $882 | $14,480 |
| 2022 | -- | $14,480 |
| 2021 | -- | $14,480 -37.7% |
| 2020 | $743 | $23,240 |
| 2019 | $743 -21.1% | $23,240 |
| 2018 | $941 -45.1% | $23,240 |
| 2017 | $1,715 +142.6% | $23,240 +11.7% |
| 2016 | $707 -7.4% | $20,800 -13.9% |
| 2014 | $764 | $24,160 -23% |
| 2013 | -- | $31,360 +30.9% |
| 2012 | -- | $23,960 |
| 2011 | -- | $23,960 |
| 2010 | -- | $23,960 |
| 2009 | -- | $23,960 |
| 2008 | -- | $23,960 |
| 2007 | -- | $23,960 |
| 2006 | -- | $23,960 -23.8% |
| 2005 | -- | $31,440 +127.8% |
| 2004 | -- | $13,800 |
| 2003 | -- | $13,800 |
| 2002 | -- | $13,800 -45.2% |
| 2001 | -- | $25,160 +33% |
| 2000 | -- | $18,920 |
Find assessor info on the county website
Monthly payment
Est. payment
Payment breakdown
Explore the cost of this home by adjusting the details. Changes won't be saved.Climate risks
Neighborhood: Binghampton


Similar homes
- $175,0004 bd2 ba1.8k sqft1036 Hudson St, Memphis, TN 38112For Sale
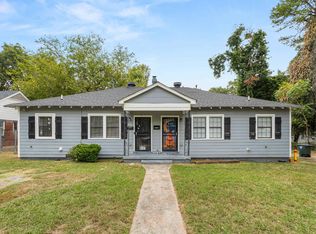 MLS ID #10230202, Jordan A Ray, eXp Realty, LLC. MAAR
- $160,0003 bd2 ba1.2k sqft757 Glankler St, Memphis, TN 38112For Sale
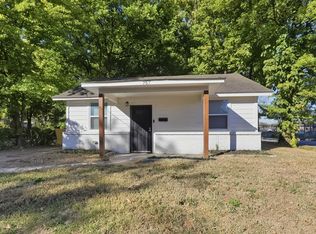 MLS ID #10233030, Adam Woodring, Mainstay Brokerage, LLC. MAAR
- $--3 bd1 ba1.1k sqft3547 Mountain Terrace St, Memphis, TN 38127Auction
 Auction.com 1
- $132,9003 bd1 ba1.2k sqft1320 Semmes St, Memphis, TN 38111For Sale
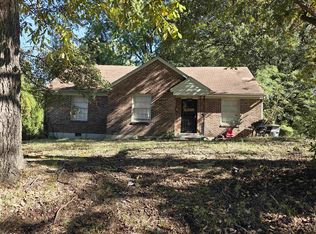 MLS ID #10233877, Dean Harris, CrestCore Realty MphsBrokerage. MAAR
