Opportunity to own a 3,000 sq/ft. R3-zoned lot! This property is being offered as raw land with no approvals currently in place. Buyer and buyer’s agent to perform their own due diligence regarding zoning, permitted uses, utilities, building requirements, and development potential. Great opportunity for builders, developers, or investors looking for their next project.
Pending
$220,000
158 Gallup St, Providence, RI 02905
--beds
0baths
3,049Square Feet
Unimproved Land
Built in ----
3,049 Square Feet Lot
$-- Zestimate®
$--/sqft
$-- HOA
What's special
Raw land
- 53 days
- 4
- 0
Zillow last checked:
Listing updated:
Listed by:
Helene Dominguez 401-688-2119,
D'Empire Real Estate LLC
Source: StateWide MLS RI,MLS#: 1424579
Facts & features
Interior
Bedrooms & bathrooms
- Bathrooms: 0
Property
Features
- Fencing: Fenced
Lot
- Size: 3,049 Square Feet
- Features: Urban
- Topography: Level
Details
- Parcel number: PROVM53L93
- Zoning description: Multi-Family,Residential
- Wooded area: 0
Utilities & green energy
- Water: Public
- Utilities for property: None, Electricity Available, Natural Gas Available
Community & HOA
Community
- Features: Highway Access, Restaurants, Schools, Near Shopping
HOA
- Has HOA: No
Location
- Region: Providence
Financial & listing details
- Tax assessed value: $118,500
- Annual tax amount: $1,730
- Date on market: 9/28/2026
Estimated market value
Not available
Estimated sales range
Not available
Not available
Price history
| Date | Event | Price |
|---|---|---|
| 10/6/2026 | Pending sale | $220,000 |
Source:  StateWide MLS RI #1424579 Report a problem | ||
| 9/28/2026 | Listed for sale | $220,000 |
Source: StateWide MLS RI #1424579 Report a problem | ||
Public tax history
| Year | Property taxes | Tax assessment |
|---|---|---|
| 2025 | $1,730 +258.2% | $118,500 +350.6% |
| 2024 | $483 +3.2% | $26,300 |
| 2023 | $468 | $26,300 |
| 2022 | $468 +64.2% | $26,300 +126.7% |
| 2021 | $285 +0% | $11,600 |
| 2020 | $285 | $11,600 |
| 2019 | $285 -15.1% | $11,600 +10.5% |
| 2018 | $336 -0.1% | $10,500 |
| 2017 | $336 | $10,500 |
| 2016 | $336 -3.4% | $10,500 |
| 2015 | $348 -1.7% | $10,500 |
| 2013 | $354 -68.3% | $10,500 -70% |
| 2012 | $1,116 | $35,000 |
| 2011 | $1,116 +5% | $35,000 |
| 2010 | $1,063 +20.2% | $35,000 -4.1% |
| 2009 | $884 +6% | $36,500 |
| 2007 | $834 +74.5% | $36,500 +131% |
| 2006 | $478 | $15,800 |
| 2005 | $478 | $15,800 |
Find assessor info on the county website
Monthly payment
Est. payment
Payment breakdown
Explore the cost of this home by adjusting the details. Changes won't be saved.Climate risks
Neighborhood: Lower South Providence
Similar homes
- $239,9003,301 sqft119 Massachusetts Ave, Providence, RI 02905Lot/Land
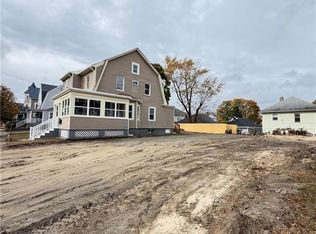
 MLS ID #1428073, Addy Sirypannho, Siry Realty. StateWide MLS RI
- $199,9003,201 sqft225 Massachusetts Ave, Providence, RI 02905Lot/Land
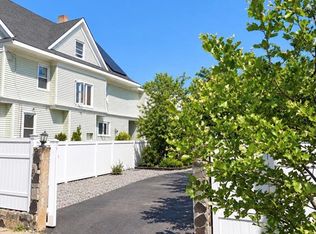 MLS ID #1425252, Collin Marchand, Residential Properties Ltd.. StateWide MLS RI
- $199,9005,279 sqft221 Bay View Ave, Cranston, RI 02905Lot/Land
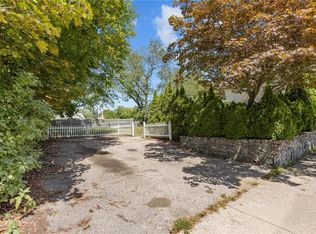 MLS ID #1423497, Matthew Kachanis, SERHANT.. StateWide MLS RI
- $199,9002,626 sqft72 Veazie St, Providence, RI 02908Lot/Land
 MLS ID #1419010, Anastasia Kaufman, REMAX Revolution. StateWide MLS RI
- $160,0004,647 sqft203 Valley St, Providence, RI 02909Lot/LandMLS ID #1424985, David Sanabria, eXp Realty LLC. StateWide MLS RI
- $189,9002,800 sqft15 Brockton St, Providence, RI 02904Lot/LandMLS ID #1425635, Kristin Coletti, Bruce Allen, REALTORS. StateWide MLS RI
- $275,00015.11 acres0 Chester St, North Smithfield, RI 02896Lot/LandMLS ID #1383364, Stacy Corrigan, Real Broker, LLC. StateWide MLS RI
- $150,0003,049 sqft0 3rd Ave, Cranston, RI 02910Lot/LandMLS ID #1424964, The ALBA Group, Innovations Realty. StateWide MLS RI
- $180,0003,201 sqft105 Anchor St, Providence, RI 02908Lot/LandMLS ID #1422406, Jesiane Fernandes, Real Broker, LLC. StateWide MLS RI
- $199,9995,201 sqft8-10 Ianthe St, Providence, RI 02904Lot/LandMLS ID #1404407, Aaron Coutu, Keller Williams Leading Edge. StateWide MLS RI
- $149,9004,556 sqft39 Bassi Ln, Providence, RI 02909Lot/LandMLS ID #1421494, Allen Gammons, BHHS Commonwealth Real Estate. StateWide MLS RI
- $175,0003,171 sqft0 Villa Dr, North Providence, RI 02911Lot/LandMLS ID #1400421, Kyle Seyboth, Century 21 Limitless. StateWide MLS RI
- $325,00010,197 sqft673 Manton Ave #R, Providence, RI 02908Lot/LandMLS ID #1427970, The ALBA Group, Innovations Realty. StateWide MLS RI
- $229,9008.62 acres263 Quaker Ln, North Scituate, RI 02857Lot/LandMLS ID #1424319, Robert Perillo, Riparian Real Estate Group. StateWide MLS RI
- $125,0004,051 sqft22 Dundas Ave, Warwick, RI 02889Lot/LandMLS ID #1428026, Erik Claros, Keller Williams Coastal. StateWide MLS RI
- $199,0005,039 sqft457 Mineral Spring Ave, Pawtucket, RI 02860Lot/LandMLS ID #1421944, Stephanie Basile, SERHANT.. StateWide MLS RI
- $149,9007,148 sqft0 Garfield St, North Providence, RI 02904Lot/LandMLS ID #1416120, The Peter Izzi Team, REMAX Revolution. StateWide MLS RI
- $219,9003.18 acres145 Winthrop St, Rehoboth, MA 02769Lot/LandMLS ID #1421687, Kathryn Hasenjaeger, Realty ONE Group Suburban Life. StateWide MLS RI
- $279,00047 acres0 Central Pike, Foster, RI 02825Lot/LandMLS ID #1412314, Stephen Antoni, Mott & Chace Sotheby's Intl.. StateWide MLS RI
