Cleared Waterfront lot with direct Gulf Access on the north end of Pine Island in Knights Bokeelia Isle. NO BRIDGES HERE. Minutes by boat to Charlotte Harbor and a short ride to the many places that the area offers like Matlacha Pass, Boca Grand Pass, the many Outer Islands and Beautiful Cayo Costa Beach. Close by are Boat Ramps, Restaurants and shopping.
Active
$225,000
16080 Tortuga St, Bokeelia, FL 33922
--beds
--baths
3,746Square Feet
Unimproved Land
Built in ----
3,746 Square Feet Lot
$-- Zestimate®
$--/sqft
$-- HOA
What's special
Direct gulf accessCleared waterfront lot
- 153 days
- 59
- 1
Zillow last checked:
Listing updated:
Listed by:
Lori Caldwell 239-560-6565,
LoKation
Source: Florida Gulf Coast MLS,MLS#: 2026026417 Originating MLS: Florida Gulf Coast
Facts & features
Interior
Video & virtual tour
Property
Features
- Has view: Yes
- View description: Canal, Partial Buildings
- Has water view: Yes
- Water view: Canal
- Waterfront features: Canal Access, Seawall
Lot
- Size: 3,746 Square Feet
- Dimensions: 50 x 80 x 50 x 80
- Features: Cleared, Rectangular Lot
- Residential vegetation: Grassed
Details
- Parcel number: 304322020000A.0350
- Lease amount: $0
- Zoning description: TFC2
Utilities & green energy
- Sewer: None, Septic Tank
- Water: Public, None
- Utilities for property: Cable Available, Electricity Available, Phone Available, Trash Collection, Water Available, Sewer Not Available, Water Not Available
Community & HOA
Community
- Features: Boat Facilities
- Condo and coop fee: $0
- Membership fee: $0
- Subdivision: KNIGHTS BOKEELIA ISLE
HOA
- Amenities included: None
- Services included: None
Location
- Region: Bokeelia
Financial & listing details
- Tax assessed value: $138,195
- Annual tax amount: $2,026
- Date on market: 6/15/2026
- Listing terms: All Financing Considered,Cash
- Electric utility on property: Yes
- Road surface type: Paved
Estimated market value
Not available
Estimated sales range
Not available
Not available
Price history
| Date | Event | Price |
|---|---|---|
| 6/15/2026 | Listed for sale | $225,000-2.1% |
Source:  Florida Gulf Coast MLS #2026026417 Report a problem | ||
| 4/9/2025 | Listing removed | $229,900 |
Source:  SWFLMLS #224035155 Report a problem | ||
| 4/17/2024 | Listed for sale | $229,900 |
Source: SWFLMLS #224035155 Report a problem | ||
| 2/5/2024 | Listing removed | -- |
Source:  Florida Gulf Coast MLS #223031158 Report a problem | ||
| 4/25/2023 | Listed for sale | $229,900+736% |
Source: Florida Gulf Coast MLS #223031158 Report a problem | ||
| 4/7/1997 | Sold | $27,500 |
Source: Public Record Report a problem | ||
Public tax history
| Year | Property taxes | Tax assessment |
|---|---|---|
| 2025 | $2,026 -2.1% | $138,195 -2.2% |
| 2024 | $2,071 -20% | $141,303 -12.1% |
| 2023 | $2,589 +13.5% | $160,811 +14.1% |
| 2022 | $2,281 +8.6% | $140,886 +6% |
| 2021 | $2,100 +4.4% | $132,902 +10% |
| 2020 | $2,011 +14.8% | $120,820 +10% |
| 2019 | $1,752 | $109,836 |
| 2018 | $1,752 +0.4% | $109,836 +14% |
| 2017 | $1,744 +8.8% | $96,336 |
| 2016 | $1,603 -1.7% | $96,336 |
| 2015 | $1,631 +2% | $96,336 +2.8% |
| 2014 | $1,599 +1.8% | $93,736 -7.5% |
| 2013 | $1,571 -7.3% | $101,336 |
| 2012 | $1,695 -21.1% | $101,336 -19.8% |
| 2011 | $2,149 -1.8% | $126,336 +0.1% |
| 2010 | $2,190 -2.9% | $126,230 -7.1% |
| 2009 | $2,256 -6% | $135,860 -9.9% |
| 2008 | $2,400 -26% | $150,860 -26.7% |
| 2007 | $3,242 -12.1% | $205,860 -8.9% |
| 2006 | $3,688 +120.6% | $225,860 +153.5% |
| 2004 | $1,672 -3.4% | $89,080 -0.7% |
| 2003 | $1,731 +68.8% | $89,720 +71.4% |
| 2002 | $1,025 | $52,360 +91.4% |
| 2000 | -- | $27,360 |
Find assessor info on the county website
Monthly payment
Climate risks
Neighborhood: 33922

Similar homes
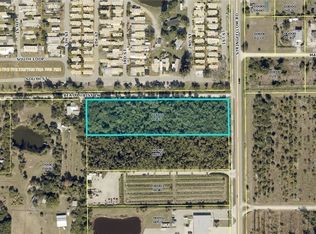
- $230,0002.43 acres14901 Stringfellow Rd, Bokeelia, FL 33922Lot/Land
 MLS ID #2026047499, Michael Shevlin, Century 21 Sunbelt Realty. Florida Gulf Coast MLS
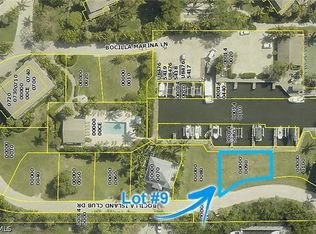
- $230,0004,007 sqft16690 Bocilla Island Club Dr, Bokeelia, FL 33922Lot/Land
 MLS ID #2026048307, Neill Fries, Castaways Island Realty LLC. Florida Gulf Coast MLS
- $230,0005,445 sqft16700 Bocilla Island Club Dr, Bokeelia, FL 33922Lot/Land
 MLS ID #2026039776, Neill Fries, Castaways Island Realty LLC. Florida Gulf Coast MLS
- $259,0005,401 sqft16220 Antigua Way, Bokeelia, FL 33922Lot/Land
 MLS ID #2025009263, Lori Caldwell, LoKation. Florida Gulf Coast MLS
- $145,0001.2 acres7655 Barrancas Ave, Bokeelia, FL 33922Lot/LandMLS ID #2026028055, Michelle Forneris, Coldwell Banker Realty. Florida Gulf Coast MLS
- $145,0001.21 acres7665 Barrancas Ave, Bokeelia, FL 33922Lot/LandMLS ID #2026000087, Matt Ristau, Coastal Realty SWFL. Florida Gulf Coast MLS
- $215,0009.19 acres12370 Sherwood Rd, Bokeelia, FL 33922Lot/LandMLS ID #2026029847, Stephen M. Longest, Coldwell Banker Realty. Florida Gulf Coast MLS
- $118,0000.98 acres15875 Bellflower St, Bokeelia, FL 33922New ConstructionMLS ID #2026011009, Lori Caldwell, LoKation. Florida Gulf Coast MLS
- $118,0000.97 acres15855 Bellflower St, Bokeelia, FL 33922Lot/LandMLS ID #2025021782, Lori Caldwell, LoKation. Florida Gulf Coast MLS
- $147,0001.5 acres7465-7448 7421 Max Dr, Bokeelia, FL 33922Lot/LandMLS ID #2025024074, Aimee Gantt, Luxury Real Estate Group LLC. Florida Gulf Coast MLS
- $115,0001.02 acres15093 MARTINIQUE WAY LOT 189, BOKEELIA, FL 33922Lot/Land
 MLS ID #A4696511, Kevin Page, CAPECORALLOTS.COM. Stellar MLS
- $115,0001.02 acresKreamers Avocado Subd, Bokeelia, FL 33922Lot/Land
 MLS ID #A12033898, Kevin Page, CapeCoralLots.com. MIAMI
- $275,0002.59 acres13236 Bottlebrush RD, BOKEELIA, FL 33922Lot/Land
 MLS ID #226039223, Catilene Ferreira, Mato Realty, LLC. SWFLMLS
- $115,8880.95 acres14999 Martinique Way, Bokeelia, FL 33922Lot/LandMLS ID #2026039230, Lisa Wilson, John R. Wood Properties. Florida Gulf Coast MLS
- $229,0002.54 acres12680 Gloria Blvd, Bokeelia, FL 33922Lot/LandMLS ID #2026025091, Norman Knoche, Engel & Voelkers Cape Coral. Florida Gulf Coast MLS
- $123,0001 acre7489 Max Dr, Bokeelia, FL 33922Lot/LandMLS ID #224006081, Aimee Gantt, Luxury Real Estate Group LLC. Florida Gulf Coast MLS
- $333,0006.68 acres5300 Game Bird Ln, Bokeelia, FL 33922Lot/LandMLS ID #225061259, Rexhina Elezi, Realmark Realty Group II LLC. Florida Gulf Coast MLS
- $225,0000.37 acres1619 NW 42nd Pl, Cape Coral, FL 33993Lot/LandMLS ID #224039444, Anthony Viola, M&M Realty Solutions LLC. Florida Gulf Coast MLS
- $225,0000.33 acres5414 Martin Cv, Bokeelia, FL 33922Lot/LandMLS ID #2025009853, Becky White, EXP Realty LLC. Florida Gulf Coast MLS
- $215,0000.4 acres5236 Martin CV, BOKEELIA, FL 33922Lot/LandMLS ID #226032766, John Zehnder, Premiere Plus Realty Company. SWFLMLS
