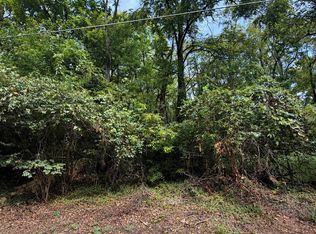
$490
-- bd-- ba-- sqft
1623 Tremont St, Cincinnati, OH 45214
Off Market
Zillow last checked:
Listing updated:
Shanel Gentry 513-725-7888,
Coldwell Banker Realty 513-922-9400
 Originating MLS: Cincinnati Area Multiple Listing Service
Not available
Estimated sales range
Not available
Not available
| Date | Event | Price |
|---|---|---|
| 9/11/2026 | Listed for sale | $5,000+300% |
Source:  Cincy MLS #1893474 Report a problem | ||
| 1/23/2020 | Sold | $1,250-16.7% |
Source: Cincy MLS #1647381 Report a problem | ||
| 1/13/2020 | Pending sale | $1,500 |
Source: ERA Real Solutions Realty #1647381 Report a problem | ||
| 10/25/2019 | Price change | $1,500-40% |
Source: ERA Real Solutions Realty #1636436 Report a problem | ||
| 9/4/2019 | Listed for sale | $2,500-68.8% |
Source: ERA Real Solutions Realty #1636436 Report a problem | ||
| 1/27/1997 | Sold | $8,000 |
Source: Public Record Report a problem | ||
| Year | Property taxes | Tax assessment |
|---|---|---|
| 2025 | $140 +0.1% | $1,992 |
| 2024 | $140 -0.2% | $1,992 |
| 2023 | $140 +209.1% | $1,992 +354.8% |
| 2022 | $45 -8.8% | $438 |
| 2021 | $50 +23.4% | $438 |
| 2020 | $40 | $438 -72.3% |
| 2019 | -- | $1,582 |
| 2018 | $298 +135% | $1,582 |
| 2017 | $127 -52.6% | $1,582 -22.9% |
| 2016 | $267 +79.9% | $2,051 |
| 2015 | $149 -0.5% | $2,051 |
| 2014 | $149 -54.2% | $2,051 -2% |
| 2013 | $326 -3.3% | $2,093 |
| 2012 | $337 -3.4% | $2,093 |
| 2011 | $349 -71.1% | $2,093 -87.5% |
| 2010 | $1,208 +1.9% | $16,692 |
| 2009 | $1,186 +26.1% | $16,692 |
| 2008 | $940 +8.8% | $16,692 -5% |
| 2007 | $864 -3.8% | $17,570 |
| 2006 | $898 +4.2% | $17,570 |
| 2005 | $862 +9% | $17,570 +34.2% |
| 2003 | $791 -16.3% | $13,090 |
| 2002 | $945 -0.1% | $13,090 +9.7% |
| 2001 | $945 -0.1% | $11,935 |
| 2000 | $946 | $11,935 |