This is a 1526 square foot, single family home. This home is located at 170 5th St, Naples, FL 34113.
Foreclosed
Street View
Est. $533,000
170 5th St, Naples, FL 34113
--beds
--baths
1,526sqft
SingleFamily
Built in 1986
10,018 Square Feet Lot
$533,000 Zestimate®
$349/sqft
$-- HOA
Overview
- 49 days
- 89
- 2
Facts & features
Interior
Interior area
- Total interior livable area: 1,526 sqft
Property
Parking
- Parking features: Garage - Attached
Lot
- Size: 10,018 Square Feet
Details
- Parcel number: 77214160002
Construction
Type & style
- Home type: SingleFamily
Condition
- Year built: 1986
Community & HOA
Location
- Region: Naples
Financial & listing details
- Price per square foot: $349/sqft
- Tax assessed value: $405,351
- Annual tax amount: $4,520
Foreclosure details
Estimated market value
$533,000
$496,000 - $570,000
$3,641/mo
Price history
| Date | Event | Price |
|---|---|---|
| 3/7/2026 | Listing removed | $535,000$351/sqft |
Source:  Florida Gulf Coast MLS #2026006537 Report a problem | ||
| 2/5/2026 | Listed for sale | $535,000-1.8%$351/sqft |
Source: Florida Gulf Coast MLS #2026006537 Report a problem | ||
| 1/31/2026 | Listing removed | $545,000$357/sqft |
Source: Florida Gulf Coast MLS #225056245 Report a problem | ||
| 1/5/2026 | Price change | $545,000-4.4%$357/sqft |
Source: Florida Gulf Coast MLS #225056245 Report a problem | ||
| 10/13/2025 | Price change | $570,000+26.9%$374/sqft |
Source: Florida Gulf Coast MLS #225056245 Report a problem | ||
| 9/15/2025 | Pending sale | $449,000$294/sqft |
Source: Florida Gulf Coast MLS #225056245 Report a problem | ||
| 9/5/2025 | Price change | $449,000-12.8%$294/sqft |
Source: Florida Gulf Coast MLS #225056245 Report a problem | ||
| 8/1/2025 | Price change | $515,000-3.7%$337/sqft |
Source: Florida Gulf Coast MLS #225056245 Report a problem | ||
| 7/21/2025 | Price change | $535,000-1.8%$351/sqft |
Source: Florida Gulf Coast MLS #225056245 Report a problem | ||
| 7/4/2025 | Price change | $545,000-5.2%$357/sqft |
Source:  SWFLMLS #225056245 Report a problem | ||
| 6/18/2025 | Listed for sale | $575,000-0.7%$377/sqft |
Source: SWFLMLS #225056245 Report a problem | ||
| 6/3/2025 | Listing removed | $579,000$379/sqft |
Source: SWFLMLS #225016497 Report a problem | ||
| 5/29/2025 | Listed for sale | $579,000$379/sqft |
Source: SWFLMLS #225016497 Report a problem | ||
| 3/25/2025 | Pending sale | $579,000$379/sqft |
Source: SWFLMLS #225016497 Report a problem | ||
| 2/15/2025 | Listed for sale | $579,000$379/sqft |
Source: SWFLMLS #225016497 Report a problem | ||
| 1/20/2025 | Listing removed | $579,000$379/sqft |
Source: SWFLMLS #224055196 Report a problem | ||
| 8/20/2024 | Listed for sale | $579,000+10.3%$379/sqft |
Source: SWFLMLS #224055196 Report a problem | ||
| 10/25/2023 | Sold | $525,000+1.9%$344/sqft |
Source: Public Record Report a problem | ||
| 9/5/2023 | Pending sale | $515,000$337/sqft |
Source: SWFLMLS #223045536 Report a problem | ||
| 8/27/2023 | Price change | $515,000-6.4%$337/sqft |
Source: SWFLMLS #223045536 Report a problem | ||
| 7/29/2023 | Price change | $550,000-2.7%$360/sqft |
Source: SWFLMLS #223045536 Report a problem | ||
| 7/21/2023 | Price change | $565,000-3.4%$370/sqft |
Source: SWFLMLS #223045536 Report a problem | ||
| 7/1/2023 | Price change | $585,000-1.7%$383/sqft |
Source: SWFLMLS #223045536 Report a problem | ||
| 6/22/2023 | Listed for sale | $595,000$390/sqft |
Source: SWFLMLS #223045536 Report a problem | ||
Public tax history
| Year | Property taxes | Tax assessment |
|---|---|---|
| 2025 | $4,520 -8.5% | $405,351 -12.9% |
| 2024 | $4,942 +11.8% | $465,386 -0.6% |
| 2023 | $4,419 +289.3% | $468,137 +225.4% |
| 2022 | $1,135 -0.5% | $143,860 +3% |
| 2021 | $1,140 +2.6% | $139,670 +1.4% |
| 2020 | $1,112 +2.4% | $137,742 +2.3% |
| 2019 | $1,086 +2.9% | $134,645 +1.9% |
| 2018 | $1,054 -16.8% | $132,134 +2.1% |
| 2017 | $1,268 +2.2% | $129,416 +2.1% |
| 2016 | $1,240 +3.4% | $126,754 +0.7% |
| 2015 | $1,199 -0.5% | $125,873 +69.2% |
| 2014 | $1,205 +19.6% | $74,374 +2.5% |
| 2013 | $1,008 +1.7% | $72,529 +2.9% |
| 2012 | $991 -1% | $70,472 -1.9% |
| 2011 | $1,001 -36.3% | $71,803 -11.9% |
| 2010 | $1,573 -14.3% | $81,508 -33% |
| 2009 | $1,835 | $121,656 -40.8% |
| 2008 | $1,835 -19.8% | $205,417 -8.5% |
| 2007 | $2,288 +33.8% | $224,539 +7.2% |
| 2006 | $1,710 | $209,432 +35.1% |
| 2005 | $1,710 +2.8% | $155,012 +3% |
| 2004 | $1,664 +8.1% | $150,497 +33.2% |
| 2003 | $1,539 +5.8% | $112,954 +7.2% |
| 2002 | $1,454 -42.7% | $105,389 +16.8% |
| 2001 | $2,539 +116.4% | $90,229 |
| 2000 | $1,173 | -- |
Find assessor info on the county website
Monthly payment
Climate risks
Neighborhood: 34113

Similar homes
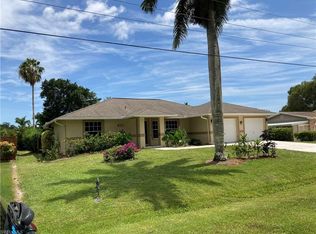
- $499,9004 bd2 ba1.2k sqft5317 Fleming ST, NAPLES, FL 34113For Sale

 MLS ID #226035653, Mercy Uribe, eXp Realty LLC. SWFLMLS
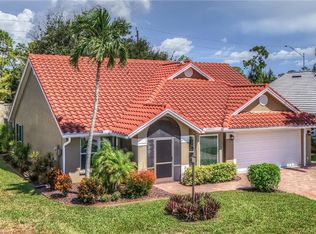
- $599,9003 bd2 ba1.4k sqft5232 Raintree LN, NAPLES, FL 34113For Sale
 MLS ID #226019950, Doreen Vachon, Downing Frye Realty Inc.. SWFLMLS
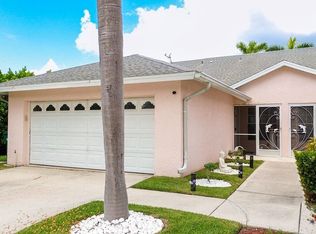
- $539,9002 bd2 ba1.6k sqft4146 Royal Wood BLVD, NAPLES, FL 34112For Sale
 MLS ID #226035298, Tony Cologero, Jr, Century 21 AllPoints Realty. SWFLMLS
- $455,0003 bd2 ba1.2k sqft439 Saint Andrews BLVD #145-0, NAPLES, FL 34113For Sale
 MLS ID #226031969, Gerardo Ballivian, Coldwell Banker Realty. SWFLMLS
- $377,9003 bd1 ba1k sqft5242 Texas Ave, Naples, FL 34113For Sale
 MLS ID #2026034808, Reyna Pacheco, Joyful Living Realty LLC. Florida Gulf Coast MLS
- $530,0003 bd2 ba1.6k sqft3161 43rd ST SW, NAPLES, FL 34116For SaleMLS ID #226029107, Rene Francisco Gutierrez, Equitable Company Realtors. SWFLMLS
- $480,0003 bd3 ba1.4k sqft4129 32nd AVE SW, NAPLES, FL 34116For SaleMLS ID #226039060, Maythe Perez, Realty One Group MVP. SWFLMLS
- $520,0003 bd3 ba1.3k sqft630 1st ST SW, NAPLES, FL 34117For SaleMLS ID #226028992, John Pineros, Waterfront Realty Group Inc. SWFLMLS
- $549,9006 bd4 ba2.1k sqft3123 Pine Tree Dr, Naples, FL 34112For SaleMLS ID #2026020364, Allen Wasko, Bay Vision Realty. Florida Gulf Coast MLS
- $479,0004 bd2 ba1.8k sqft883 Coconut CIR E, NAPLES, FL 34104For SaleMLS ID #226038457, Mauricio Cifuentes, A Plus Realty. SWFLMLS
- $499,0006 bd3 ba1.8k sqft4107 Mindi AVE, NAPLES, FL 34112For SaleMLS ID #226013397, Matthew Schuch, Sun Realty International, Inc. SWFLMLS
- $585,0003 bd2 ba1.6k sqft(Undisclosed Address), NAPLES, FL 34104For SaleMLS ID #225077316, Ivia Garcia, Premiere Plus Realty Company. SWFLMLS
- $460,0003 bd2 ba1.4k sqft3323 Guilford CT, NAPLES, FL 34112For SaleMLS ID #226012110, Dorothea A Kelsey, Premiere Plus Realty Company. SWFLMLS
- $429,0002 bd2 ba1.5k sqft7128 Marconi CT, NAPLES, FL 34114For SaleMLS ID #226034619, Vic Cuccia, Veronawalk Realty, Inc.. SWFLMLS
- $599,0003 bd2 ba1.5k sqft3470 White BLVD, NAPLES, FL 34117For SaleMLS ID #226026822, Maria Cuello Caviedes, Xclusive Homes LLC. SWFLMLS
- $429,5004 bd2 ba1.6k sqft4920 Cortez CIR, NAPLES, FL 34112For SaleMLS ID #226007733, Justin Payero, A Plus Realty. SWFLMLS
- $585,0003 bd2 ba1.5k sqft360 Jung BLVD W, NAPLES, FL 34120For SaleMLS ID #226030769, Freddy Garcia, Keller Williams Realty Naples. SWFLMLS
- $499,0002 bd2 ba1.1k sqft79 Johnnycake DR, NAPLES, FL 34110For SaleMLS ID #226039614, Chance Caswell, VPR United Real Estate. SWFLMLS
- $551,9004 bd2 ba1.7k sqft4295 14th ST NE, NAPLES, FL 34120For SaleMLS ID #226031045, Diana Chavez, Mato Realty, LLC. SWFLMLS
