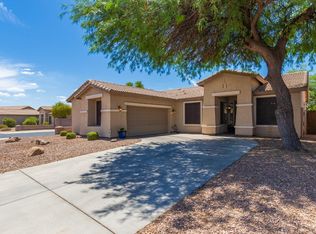
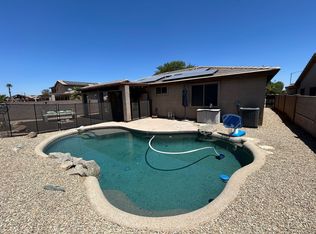
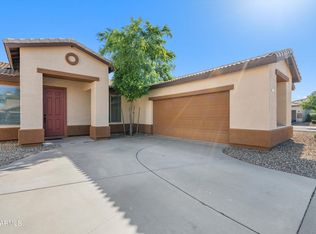
This 1790 square foot single family home has 3 bedrooms and 2.0 bathrooms. This home is located at 1710 S 159th Ave, Goodyear, AZ 85338.
Pre-foreclosure

Est. $373,700
1710 S 159th Ave, Goodyear, AZ 85338
3beds
2baths
1,790sqft
Single Family Residence
Built in 2002
-- sqft lot
$373,700 Zestimate®
$209/sqft
$-- HOA
Overview
- 106 days
- 53
- 3
Zillow last checked:
Source: Hubzu REO,MLS#: 94617807265
Facts & features
Interior
Bedrooms & bathrooms
- Bedrooms: 3
- Bathrooms: 2
Features
- Has basement: No
Interior area
- Total structure area: 1,790
- Total interior livable area: 1,790 sqft
Property
Details
- Parcel number: 50090039
Construction
Type & style
- Home type: SingleFamily
- Property subtype: Single Family Residence
Condition
- Year built: 2002
Community & HOA
Location
- Region: Goodyear
Financial & listing details
- Price per square foot: $209/sqft
- Tax assessed value: $313,300
- Annual tax amount: $1,627
- Date on market: 9/25/2026
- Lease term: Contact For Details

Foreclosure details
Estimated market value
$373,700
$355,000 - $392,000
$2,008/mo
Price history
| Date | Event | Price |
|---|---|---|
| 10/14/2026 | Listing removed | -- |
Source:  Hubzu REO #94617807265 Report a problem | ||
| 9/25/2026 | Pending sale | -- |
Source: Hubzu REO #94617807265 Report a problem | ||
| 3/25/2026 | Listing removed | $1,795$1/sqft |
Source: Zillow Rentals Report a problem | ||
| 3/16/2026 | Price change | $1,795-10%$1/sqft |
Source: Zillow Rentals Report a problem | ||
| 1/10/2026 | Price change | $1,995-4.8%$1/sqft |
Source: Zillow Rentals Report a problem | ||
| 12/6/2025 | Listed for rent | $2,095+16.7%$1/sqft |
Source: Zillow Rentals Report a problem | ||
| 7/29/2024 | Listing removed | -- |
Source: Zillow Rentals Report a problem | ||
| 7/17/2024 | Price change | $1,795-3%$1/sqft |
Source: Zillow Rentals Report a problem | ||
| 7/3/2024 | Price change | $1,850-2.6%$1/sqft |
Source: Zillow Rentals Report a problem | ||
| 6/6/2024 | Price change | $1,900-2.6%$1/sqft |
Source: Zillow Rentals Report a problem | ||
| 5/29/2024 | Price change | $1,950-2.5%$1/sqft |
Source: Zillow Rentals Report a problem | ||
| 5/14/2024 | Price change | $2,000-4.8%$1/sqft |
Source: Zillow Rentals Report a problem | ||
| 4/4/2024 | Listed for rent | $2,100+10.5%$1/sqft |
Source: Zillow Rentals Report a problem | ||
| 2/23/2023 | Listing removed | -- |
Source: Zillow Rentals Report a problem | ||
| 2/22/2023 | Listed for rent | $1,900$1/sqft |
Source: Zillow Rentals Report a problem | ||
| 2/24/2021 | Sold | $330,000+2650%$184/sqft |
Source: Public Record Report a problem | ||
| 10/4/2019 | Sold | $12,000$7/sqft |
Source: Public Record Report a problem | ||
| 4/2/2019 | Sold | $12,000-92.1%$7/sqft |
Source: Public Record Report a problem | ||
| 12/20/2002 | Sold | $150,949$84/sqft |
Source: Public Record Report a problem | ||
Public tax history
| Year | Property taxes | Tax assessment |
|---|---|---|
| 2025 | $1,627 +7.6% | $31,330 -11.8% |
| 2024 | $1,512 +0.9% | $35,520 +173.2% |
| 2023 | $1,498 +2.6% | $13,003 -39.9% |
| 2022 | $1,459 +11.6% | $21,650 +9.5% |
| 2021 | $1,308 +2.5% | $19,780 +4.9% |
| 2020 | $1,276 +0.2% | $18,860 +11.9% |
| 2019 | $1,273 | $16,850 +8.2% |
| 2018 | $1,273 +1.3% | $15,580 +12.2% |
| 2017 | $1,256 +4.7% | $13,880 +6.2% |
| 2016 | $1,200 -1.4% | $13,070 +5.7% |
| 2015 | $1,218 | $12,370 +36.2% |
| 2014 | -- | $9,080 +19.2% |
| 2013 | -- | $7,620 -7.7% |
| 2012 | -- | $8,260 -6.2% |
| 2011 | -- | $8,810 -18.7% |
| 2010 | -- | $10,830 -31.9% |
| 2009 | -- | $15,910 -25.7% |
| 2008 | -- | $21,400 +12.3% |
| 2007 | -- | $19,050 +45.4% |
| 2006 | -- | $13,100 |
| 2005 | -- | $13,100 +1.6% |
| 2004 | -- | $12,900 |
Find assessor info on the county website