Unapproved short sale. SFH in highly desired neighborhood. Interior needs complete workup, kitchen, bathrooms, flooring, electrical and painting all need to be completed. Cash Buyers Only, submit POF with offers.
Accepting backups
$225,000
1716 SW 3rd Pl, Cape Coral, FL 33991
3beds
--sqft
Single Family Residence
Built in 2006
-- sqft lot
$-- Zestimate®
$--/sqft
$-- HOA
What's special
- 29 days
- 460
- 26
Likely to sell faster than
Zillow last checked:
Listing updated:
Listed by:
Alexander Viera moderninternationalrealestatei@gmail.com,
Modern International Real Estate INC
Source: MIAMI,MLS#: A12093257 Originating MLS: A-Miami Association of REALTORS
Facts & features
Interior
Bedrooms & bathrooms
- Bedrooms: 3
- Bathrooms: 2
- Full bathrooms: 2
Rooms
- Room types: Den/Library/Office
Heating
- Central
Cooling
- Central Air
Appliances
- Included: Dishwasher, Dryer, Electric Range, Microwave, Refrigerator, Washer
Features
- Flooring: Tile, Vinyl
Property
Parking
- Total spaces: 2
- Parking features: Additional Spaces Available, Driveway
- Garage spaces: 2
- Has uncovered spaces: Yes
Features
- Stories: 1
- Entry location: First Floor Entry
- Patio & porch: Patio
- Pool features: R30-No Pool/No Water
- Has spa: Yes
- Fencing: Fenced
- View description: None
Lot
- Features: Less Than 1/4 Acre Lot
Details
- Parcel number: 264423C203090.0370
- Zoning: R1-D
- Special conditions: Short Sale
Construction
Type & style
- Home type: SingleFamily
- Property subtype: Single Family Residence
Materials
- Concrete Block Construction, Stucco
- Roof: Shingle
Condition
- Year built: 2006
Utilities & green energy
- Sewer: Public Sewer
- Water: Municipal Water
Community & HOA
Community
- Features: Sidewalks, Street Lights
- Subdivision: Cape Coral Unit 62
HOA
- Has HOA: No
Location
- Region: Cape Coral
Financial & listing details
- Tax assessed value: $305,553
- Annual tax amount: $4,978
- Date on market: 9/21/2026
- Listing terms: All Cash
- Road surface type: Paved Road
Estimated market value
Not available
Estimated sales range
Not available
Not available
Price history
| Date | Event | Price |
|---|---|---|
| 9/21/2026 | Listed for sale | $225,000 |
Source:  MIAMI #A12093257 Report a problem | ||
| 9/10/2026 | Listing removed | $225,000 |
Source:  Florida Gulf Coast MLS #2026020625 Report a problem | ||
| 7/21/2026 | Pending sale | $225,000 |
Source: Florida Gulf Coast MLS #2026020625 Report a problem | ||
| 7/13/2026 | Listed for sale | $225,000 |
Source: Florida Gulf Coast MLS #2026020625 Report a problem | ||
| 5/12/2026 | Pending sale | $225,000 |
Source: Florida Gulf Coast MLS #2026020625 Report a problem | ||
| 5/6/2026 | Listed for sale | $225,000-45.1% |
Source: Florida Gulf Coast MLS #2026020625 Report a problem | ||
| 8/2/2024 | Listing removed | -- |
Source:  SWFLMLS #224061102 Report a problem | ||
| 7/24/2024 | Listed for sale | $410,000+6.5% |
Source: SWFLMLS #224061102 Report a problem | ||
| 7/31/2023 | Sold | $385,000 |
Source: Florida Gulf Coast MLS #223045909 Report a problem | ||
| 7/4/2023 | Pending sale | $385,000 |
Source:  Florida Gulf Coast MLS #223045909 Report a problem | ||
| 6/21/2023 | Listed for sale | $385,000+226.3% |
Source: Florida Gulf Coast MLS #223045909 Report a problem | ||
| 5/21/2012 | Sold | $118,000-7% |
Source: Public Record Report a problem | ||
| 3/15/2012 | Price change | $126,900-8.6% |
Source: Sandbill Realty Group #201206650 Report a problem | ||
| 2/18/2012 | Listed for sale | $138,900+15.8% |
Source: Sandbill Realty Group #201206650 Report a problem | ||
| 1/6/2009 | Sold | $120,000+474.2% |
Source: Public Record Report a problem | ||
| 1/20/2004 | Sold | $20,900+49.3% |
Source: Public Record Report a problem | ||
| 12/17/2003 | Sold | $14,000 |
Source: Public Record Report a problem | ||
Public tax history
| Year | Property taxes | Tax assessment |
|---|---|---|
| 2025 | $4,978 +5.6% | $293,108 +2.9% |
| 2024 | $4,716 +81.1% | $284,847 +87.8% |
| 2023 | $2,604 +9.2% | $151,656 +3% |
| 2022 | $2,384 -0.4% | $147,296 |
| 2021 | $2,393 -0.5% | -- |
| 2020 | $2,406 +3.3% | $141,623 -29.8% |
| 2019 | $2,329 | $201,877 +48.6% |
| 2018 | $2,329 +0.8% | $135,858 +2.1% |
| 2017 | $2,310 +0.8% | $133,064 -20.5% |
| 2016 | $2,291 +5% | $167,285 +10.9% |
| 2015 | $2,182 +0.1% | $150,807 +10.9% |
| 2014 | $2,179 -30.5% | $135,993 +9.3% |
| 2013 | $3,136 -7.5% | $124,398 +21.6% |
| 2012 | $3,390 +4.9% | $102,293 +9.8% |
| 2011 | $3,233 +2.2% | $93,132 +6.3% |
| 2010 | $3,162 -6.6% | $87,602 -11% |
| 2009 | $3,384 -34.3% | $98,430 -53.4% |
| 2008 | $5,149 +10.7% | $211,090 -16.5% |
| 2007 | $4,654 +197.4% | $252,770 +204.5% |
| 2006 | $1,565 +426.6% | $83,000 +591.7% |
| 2004 | $297 +88.6% | $12,000 +118.6% |
| 2003 | $158 +20.2% | $5,490 +26.8% |
| 2002 | $131 | $4,330 +49.3% |
| 2000 | -- | $2,900 |
Find assessor info on the county website
Monthly payment
Est. payment
Payment breakdown
Explore the cost of this home by adjusting the details. Changes won't be saved.Climate risks
Neighborhood: 33991

Similar homes
- $244,9003 bd2 ba1.4k sqft818 SW 8th Ct, Cape Coral, FL 33991For Sale
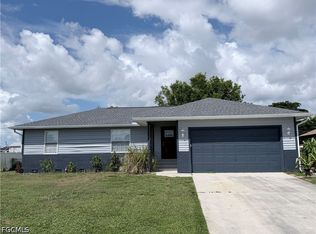
 MLS ID #2026036219, Eric Potts, 1 Percent Lists SWFL. Florida Gulf Coast MLS
- $245,0003 bd2 ba1.2k sqft416 SE 19th TER, CAPE CORAL, FL 33990For Sale

 MLS ID #226027691, Jon McLeod, PA, NextHome Luxe Coastal. SWFLMLS
- $225,9003 bd2 ba1.2k sqft1329 NE 17th St, Cape Coral, FL 33909For Sale
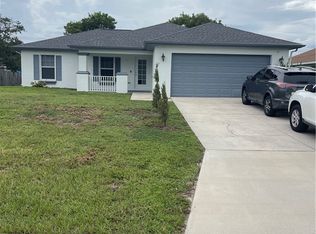 MLS ID #2026041278, Chris Chatelier, Emmanuel Realty Corner. Florida Gulf Coast MLS
- $334,9903 bd2 ba1.5k sqft403 SE 22nd ST, CAPE CORAL, FL 33990For Sale
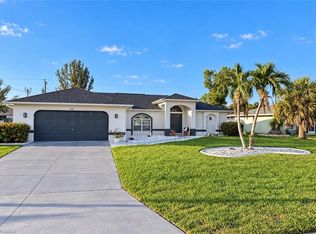 MLS ID #226033673, Rubby Lopez, Xclusive Homes LLC. SWFLMLS
- $240,0003 bd2 ba1.1k sqft1006 NE 2nd AVE, CAPE CORAL, FL 33909For SaleMLS ID #226021087, Jeff Alva, Marzucco Real Estate. SWFLMLS
- $299,0003 bd2 ba1.4k sqft1621 SW 14th Ter, Cape Coral, FL 33991For SaleMLS ID #2026026487, Richie Rodriguez, Starlink Realty, Inc. Florida Gulf Coast MLS
- $269,0003 bd2 ba1.4k sqft1004 NW 7th Ave, Cape Coral, FL 33993For SaleMLS ID #2026036306, Andrew Labash, Vista Group Realty. Florida Gulf Coast MLS
- $259,0003 bd2 ba1.4k sqft122 NW 15th Ter, Cape Coral, FL 33993For SaleMLS ID #2025007925, Andrew Labash, Vista Group Realty. Florida Gulf Coast MLS
- $320,0003 bd2 ba1.5k sqft2212 SW Santa Barbara Pl, Cape Coral, FL 33991For SaleMLS ID #2026023277, Ying Lin, Lee International Realty Inc. Florida Gulf Coast MLS
- $299,0003 bd3 ba1.9k sqft4472 Coronado Pkwy, Cape Coral, FL 33904For SaleMLS ID #2026043312, Christine Lussa, EXP Realty LLC. Florida Gulf Coast MLS
- $169,9002 bd3 ba1.1k sqft707 SW 3rd Ct APT 103, Cape Coral, FL 33991For SaleMLS ID #2026042113, Mike Lombardo, Old Glory Realty. Florida Gulf Coast MLS
- $285,0004 bd2 ba1.7k sqft10 NE 20th St, Cape Coral, FL 33909For SaleMLS ID #2026041972, Rick Pitts, SellState Excelsior Realty. Florida Gulf Coast MLS
- $324,0003 bd2 ba1.4k sqft302 SE 1st Pl, Cape Coral, FL 33990For SaleMLS ID #2026040632, Ailyn Betancourt, Best Deals Realty LLC. Florida Gulf Coast MLS
- $244,0002 bd2 ba1.1k sqft1404 SE 34th Ter, Cape Coral, FL 33904For SaleMLS ID #2026019592, Stephanie Davidson, LPT Realty, LLC. Florida Gulf Coast MLS
- $316,9633 bd2 ba1.2k sqft161 SE 18th Ter, Cape Coral, FL 33990For SaleMLS ID #224090812, MarZia RiVera Rodriguez Rivera, Southern World LLC. Florida Gulf Coast MLS
- $299,9003 bd2 ba1.2k sqft306 SW 29th St, Cape Coral, FL 33914For SaleMLS ID #2026019567, Judith Anglin, LPT Realty, LLC. Florida Gulf Coast MLS
- $299,9004 bd2 ba2k sqft(Undisclosed Address), Cape Coral, FL 33993For SaleMLS ID #2026041349, Lisa Nicely, Florida Resale Properties Inc. Florida Gulf Coast MLS
- $269,9003 bd2 ba1.1k sqft2124 NE 7th Pl, Cape Coral, FL 33909For SaleMLS ID #2026029382, Zachary Schmidgall, Legacy Premier Realty LLC. Florida Gulf Coast MLS
- $230,0003 bd2 ba960 sqft2609 Owen AVE S, LEHIGH ACRES, FL 33973For SaleMLS ID #225025719, Lauralee Chisolm, Realty Hub. SWFLMLS
