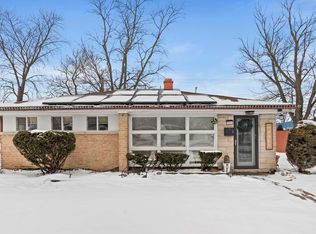
$148,700
2 bd|1 ba|945 sqft
17252 Walter St, Lansing, IL 60438
Off Market
Zillow last checked:
Timothy Williams (708)243-3653,
eXp Realty
Not available
Estimated sales range
Not available
Not available
| Date | Event | Price |
|---|---|---|
| 5/28/2026 | Contingent | $155,000$124/sqft |
Source: eXp Realty #12655656 Report a problem | ||
| 5/22/2026 | Listed for sale | $155,000-6%$124/sqft |
Source: eXp Realty #12655656 Report a problem | ||
| 12/27/2025 | Listing removed | $164,900$132/sqft |
Source: | ||
| 12/2/2025 | Price change | $164,900-5.7%$132/sqft |
Source: | ||
| 10/27/2025 | Listed for sale | $174,900+133.2%$140/sqft |
Source: | ||
| 8/22/2013 | Sold | $75,000+0.1%$60/sqft |
Source: | ||
| 4/10/2013 | Price change | $74,900-11.8%$60/sqft |
Source: RE/MAX Action #08302574 Report a problem | ||
| 3/30/2013 | Listed for sale | $84,900+239.6%$68/sqft |
Source: RE/MAX Action #08302574 Report a problem | ||
| 1/7/2013 | Sold | $25,000-16.4%$20/sqft |
Source: | ||
| 11/15/2012 | Price change | $29,900+12.8%$24/sqft |
Source: Realty Executives Target #08171302 Report a problem | ||
| 10/13/2012 | Price change | $26,500-11.4%$21/sqft |
Source: Realty Executives Target #08171302 Report a problem | ||
| 10/3/2012 | Listed for sale | $29,900-67.7%$24/sqft |
Source: Realty Executives Target #08171302 Report a problem | ||
| 12/30/1999 | Sold | $92,500$74/sqft |
Source: Public Record Report a problem | ||
| Year | Property taxes | Tax assessment |
|---|---|---|
| 2024 | -- | $11,000 +0% |
| 2023 | $3,718 +38.7% | $10,999 +45.8% |
| 2022 | $2,680 +0.6% | $7,544 |
| 2021 | $2,664 +2.2% | $7,544 |
| 2020 | $2,606 +27.9% | $7,544 +7.6% |
| 2019 | $2,038 +2.1% | $7,009 |
| 2018 | $1,997 -2.6% | $7,009 |
| 2017 | $2,050 -26.1% | $7,009 -7.4% |
| 2016 | $2,776 +10.4% | $7,573 |
| 2015 | $2,515 +0.3% | $7,573 |
| 2014 | $2,508 -35.5% | $7,573 -12.3% |
| 2013 | $3,889 +51.3% | $8,638 |
| 2012 | $2,571 -0.7% | $8,638 |
| 2011 | $2,590 -24.1% | $8,638 -19.7% |
| 2010 | $3,413 +2% | $10,754 |
| 2009 | $3,345 +10.4% | $10,754 -5% |
| 2008 | $3,031 +7.4% | $11,319 +7.4% |
| 2007 | $2,821 -12% | $10,537 |
| 2006 | $3,206 +1.8% | $10,537 |
| 2005 | $3,151 +52.4% | $10,537 +19.6% |
| 2004 | $2,068 -15.9% | $8,813 |
| 2003 | $2,458 +18% | $8,813 |
| 2002 | $2,084 +13.4% | $8,813 +12.9% |
| 2001 | $1,838 +1.3% | $7,807 |
| 2000 | $1,814 +107.2% | $7,807 |
| 1999 | $876 | $7,807 |
Find assessor info on the county website
Source: MRED as distributed by MLS GRID. This data may not be complete. We recommend contacting the local school district to confirm school assignments for this home.
A local agent can set up tours, give advice and negotiate with sellers.