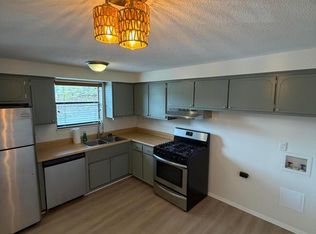
2 BR condo located on Eastside of Columbus just minutes from 70 and 270, all shopping and entertainment. Condo has been completely renovated. Stainless appliances, tile floors in kitchen and bath, LVT throughout unit, new cabinets, new ptech unit.
For sale
Price cut: $5K (10/26)
$104,900
1726 Sunapple Way, Columbus, OH 43232
2beds
864sqft
Condominium
Built in 1980
-- sqft lot
$-- Zestimate®
$121/sqft
$280/mo HOA
What's special
Stainless appliancesNew cabinetsCompletely renovatedLvt throughout unit
- 44 days
- 345
- 26
Zillow last checked:
Listing updated:
Listed by:
William Lindsey 614-747-5834,
Red 1 Realty
Source: Columbus and Central Ohio Regional MLS ,MLS#: 226036749
Facts & features
Interior
Bedrooms & bathrooms
- Bedrooms: 2
- Bathrooms: 1
- Full bathrooms: 1
- Main level bedrooms: 2
Heating
- Electric
Features
- Common walls with other units/homes: No One Below,No One Above,2+ Common Walls
Interior area
- Total structure area: 864
- Total interior livable area: 864 sqft
Property
Parking
- Parking features: Common
Features
- Levels: One
- Patio & porch: Patio
Lot
- Size: 871 Square Feet
Details
- Parcel number: 010186862
Construction
Type & style
- Home type: Condo
- Architectural style: Ranch
- Property subtype: Condominium
Materials
- Foundation: Slab
Condition
- New construction: No
- Year built: 1980
Utilities & green energy
- Sewer: Public Sewer
- Water: Public
Community & HOA
Community
- Subdivision: APPLEWAY EAST CONDO
HOA
- Has HOA: Yes
- Services included: Maintenance Grounds
- HOA fee: $280 monthly
Location
- Region: Columbus
Financial & listing details
- Price per square foot: $121/sqft
- Tax assessed value: $62,600
- Annual tax amount: $1,157
- Date on market: 9/26/2026
Estimated market value
Not available
Estimated sales range
Not available
Not available
Price history
| Date | Event | Price |
|---|---|---|
| 10/26/2026 | Price change | $104,900-4.5%$121/sqft |
Source:  Columbus and Central Ohio Regional MLS #226036749 Report a problem | ||
| 10/6/2026 | Price change | $109,900-4.4%$127/sqft |
Source: Columbus and Central Ohio Regional MLS #226036749 Report a problem | ||
| 9/26/2026 | Listed for sale | $115,000+7%$133/sqft |
Source: Columbus and Central Ohio Regional MLS #226036749 Report a problem | ||
| 7/30/2026 | Listing removed | $107,500$124/sqft |
Source: Columbus and Central Ohio Regional MLS #226016675 Report a problem | ||
| 6/24/2026 | Listing removed | $1,350$2/sqft |
Source: Zillow Rentals Report a problem | ||
| 6/23/2026 | Contingent | $107,500$124/sqft |
Source: Columbus and Central Ohio Regional MLS #226016675 Report a problem | ||
| 6/20/2026 | Price change | $107,500-2.2%$124/sqft |
Source: Columbus and Central Ohio Regional MLS #226016675 Report a problem | ||
| 6/3/2026 | Listed for rent | $1,350$2/sqft |
Source: Zillow Rentals Report a problem | ||
| 5/16/2026 | Listed for sale | $109,900+83.2%$127/sqft |
Source: Columbus and Central Ohio Regional MLS #226016675 Report a problem | ||
| 3/27/2025 | Sold | $60,000+33.3%$69/sqft |
Source: Public Record Report a problem | ||
| 8/21/2003 | Sold | $45,000+45.2%$52/sqft |
Source: Public Record Report a problem | ||
| 6/1/1994 | Sold | $31,000$36/sqft |
Source: Public Record Report a problem | ||
Public tax history
| Year | Property taxes | Tax assessment |
|---|---|---|
| 2025 | $1,007 +0.3% | $21,910 |
| 2024 | $1,004 +3.4% | $21,910 |
| 2023 | $971 +45.7% | $21,910 +70.5% |
| 2022 | $666 -0.2% | $12,850 |
| 2021 | $668 -0.1% | $12,850 |
| 2020 | $669 -5.7% | $12,850 +9.9% |
| 2019 | $709 +0.2% | $11,690 |
| 2018 | $708 | $11,690 |
| 2017 | $708 -5% | $11,690 +4% |
| 2016 | $745 +804.1% | $11,240 |
| 2015 | $82 | $11,240 |
| 2014 | $82 -10.1% | $11,240 -5% |
| 2013 | $92 -48.9% | $11,830 |
| 2011 | $179 -48.6% | $11,830 -21.4% |
| 2010 | $349 +6.4% | $15,050 |
| 2008 | $328 -50.3% | $15,050 |
| 2007 | $659 +0.4% | -- |
| 2006 | $657 +4.2% | -- |
| 2005 | $630 -3.1% | -- |
| 2004 | $650 +20.1% | -- |
| 2003 | $541 +0.4% | -- |
| 2002 | $539 +3.9% | -- |
| 2001 | $519 -0.5% | -- |
| 2000 | $522 | -- |
Find assessor info on the county website
Monthly payment
Est. payment
Payment breakdown
Explore the cost of this home by adjusting the details. Changes won't be saved.Climate risks
Neighborhood: Livingston - McNaughten

Similar homes
- $104,9001 bd1 ba788 sqft1635 McNaughten Rd #B, Columbus, OH 43232For Sale
 MLS ID #226037660, Michael P Smith, Trade In Your House Realty. Columbus and Central Ohio Regional MLS
- $124,9002 bd2 ba1.1k sqft5366 Yorkshire Village Ln #B-22, Columbus, OH 43232For Sale
 MLS ID #226012815, Mark D Corbin, NextHome Experience. Columbus and Central Ohio Regional MLS
- $124,9001 bd1 ba788 sqft5844 Hallridge Cir APT B, Columbus, OH 43232For Sale
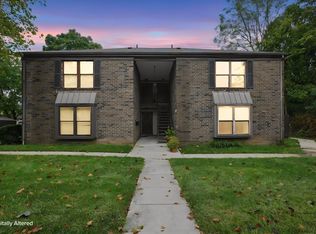 MLS ID #226034845, Katharine A Blades, Coldwell Banker Realty. Columbus and Central Ohio Regional MLS
- $149,9002 bd2 ba1.1k sqft1599 McNaughten Rd, Columbus, OH 43232For Sale
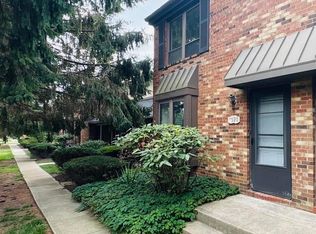 MLS ID #226030067, Tara N Woodford, Woodford Contemporary. Columbus and Central Ohio Regional MLS
- $99,0002 bd2 ba1k sqft6532 San Miguel Pl, Reynoldsburg, OH 43068For SaleMLS ID #226025901, Maryia Ivanova, Carleton Realty, LLC. Columbus and Central Ohio Regional MLS
- $126,9002 bd1 ba960 sqft2538 Nassau Dr #29B, Columbus, OH 43232For SaleMLS ID #226039777, Omar El Mejjaty, Carleton Realty, LLC. Columbus and Central Ohio Regional MLS
- $105,0002 bd1 ba828 sqft1709 Wilson Ave, Columbus, OH 43207For SaleMLS ID #226042093, Aaron T Singerman, Real of Ohio . Columbus and Central Ohio Regional MLS
- $104,9002 bd2 ba960 sqft2370 Woodbrook Cir S APT C, Columbus, OH 43223For SaleMLS ID #226039150, Andrea R Kaper, Keller Williams Consultants. Columbus and Central Ohio Regional MLS
- $99,9902 bd1 ba882 sqft4117 Karl Rd APT 208, Columbus, OH 43224For SaleMLS ID #226028567, Phillip Warren Stern, Realistar. Columbus and Central Ohio Regional MLS
- $104,9002 bd1 ba744 sqft221 N Kellner Rd, Columbus, OH 43209For SaleMLS ID #226027932, Deandra Bryant, Trelora Realty, Inc. Columbus and Central Ohio Regional MLS
- $115,0003 bd3 ba1.2k sqft2312 Hardesty Ct #H-2, Columbus, OH 43204For SaleMLS ID #226035204, Mark Vennitti, Coldwell Banker Realty. Columbus and Central Ohio Regional MLS
- $110,0002 bd2 ba1.1k sqft4 Oak Rd Unit 4, Columbus, OH 43217For SaleMLS ID #226041365, Remington Lyman, Reafco. Columbus and Central Ohio Regional MLS
- $139,9003 bd1 ba836 sqft3385 Bruceton Ave, Columbus, OH 43232For SaleMLS ID #226028362, Lisa Pulsfort, Trelora Realty, Inc. Columbus and Central Ohio Regional MLS
- $84,9001 bd2 ba882 sqft4115 Karl Rd APT 207, Columbus, OH 43224For SaleMLS ID #226036920, Shawn M Hageman, RE/MAX Capital Centre. Columbus and Central Ohio Regional MLS
- $129,9972 bd1 ba884 sqft2220 Myrtle Ave, Columbus, OH 43211For SaleMLS ID #226041777, Tristam Griffith, Cap Rate Realty. Columbus and Central Ohio Regional MLS
- $99,0002 bd1 ba1k sqft473 Catherine St, Columbus, OH 43223For SaleMLS ID #226040482, Scott Eric Harmsen, Red 1 Realty. Columbus and Central Ohio Regional MLS
- $149,9002 bd1 ba896 sqft233 Macenroe Dr #70C, Blacklick, OH 43004For SaleMLS ID #226034464, Dawn R Finch, Coldwell Banker Realty. Columbus and Central Ohio Regional MLS
- $134,9003 bd1 ba912 sqft1731 Burlington Ave, Columbus, OH 43227For SaleMLS ID #226033468, Eva Marie Hockenberry, Mainstay Brokerage LLC. Columbus and Central Ohio Regional MLS
- $119,0002 bd1 ba686 sqft2237 Parkwood Ave, Columbus, OH 43211For SaleMLS ID #226027592, Tristam Griffith, Cap Rate Realty. Columbus and Central Ohio Regional MLS
