Contractor Special! Great opportunity for investors, contractors, or buyers looking for their next project. This property offers plenty of potential for renovation and customization. Bring your vision, tools, and creativity to transform this home into something special. Ideal for those looking to add value and build equity. Sold as-is.
Pending
$135,000
1727 DIBBLE Circle W, Jacksonville, FL 32246
3beds
1,212sqft
Single Family Residence
Built in 1958
9,583 Square Feet Lot
$-- Zestimate®
$111/sqft
$-- HOA
What's special
- 16 days
- 852
- 48
Likely to sell faster than
Zillow last checked:
Listing updated:
Listed by:
JASON A WEBB 813-365-7048,
NJS REALTY PLLC 727-940-7639
Source: realMLS,MLS#: 2171196
Facts & features
Interior
Bedrooms & bathrooms
- Bedrooms: 3
- Bathrooms: 1
- Full bathrooms: 1
Heating
- Central, Electric
Cooling
- Central Air, Electric
Appliances
- Included: None
Interior area
- Total interior livable area: 1,212 sqft
Property
Parking
- Total spaces: 1
- Parking features: Carport
- Carport spaces: 1
Features
- Levels: One
- Stories: 1
Lot
- Size: 9,583 Square Feet
Details
- Parcel number: 1636200000
Construction
Type & style
- Home type: SingleFamily
- Property subtype: Single Family Residence
Materials
- Roof: Shingle
Condition
- New construction: No
- Year built: 1958
Utilities & green energy
- Sewer: Public Sewer
- Water: Public
- Utilities for property: Electricity Connected, Water Connected
Community & HOA
Community
- Subdivision: Atlantic Manor
HOA
- Has HOA: No
Location
- Region: Jacksonville
Financial & listing details
- Price per square foot: $111/sqft
- Tax assessed value: $145,686
- Annual tax amount: $2,483
- Date on market: 10/28/2026
- Listing terms: Cash
Estimated market value
Not available
Estimated sales range
Not available
Not available
Price history
| Date | Event | Price |
|---|---|---|
| 11/9/2026 | Pending sale | $135,000$111/sqft |
Source:  realMLS #2171196 Report a problem | ||
| 10/28/2026 | Listed for sale | $135,000+172.7%$111/sqft |
Source: realMLS #2171196 Report a problem | ||
| 9/23/2017 | Listing removed | $1,295$1/sqft |
Source: Apecs Home Solutions, LLC Report a problem | ||
| 8/24/2017 | Listed for rent | $1,295+17.7%$1/sqft |
Source: Apecs Home Solutions, LLC Report a problem | ||
| 6/20/2017 | Listing removed | $1,100$1/sqft |
Source: St. Johns Properties Report a problem | ||
| 5/23/2017 | Listed for rent | $1,100$1/sqft |
Source: St. Johns Properties Report a problem | ||
| 4/18/2016 | Listing removed | $1,100+17.6%$1/sqft |
Source: Lenger Asset Management Report a problem | ||
| 7/2/2015 | Listing removed | $935$1/sqft |
Source: Owner Report a problem | ||
| 6/17/2015 | Listed for rent | $935-5.1%$1/sqft |
Source: Owner Report a problem | ||
| 9/7/2014 | Listing removed | $985$1/sqft |
Source: EXIT 1 Stop Realty Report a problem | ||
| 7/26/2014 | Price change | $985-6.2%$1/sqft |
Source: EXIT 1 Stop Realty Report a problem | ||
| 6/12/2014 | Listed for rent | $1,050$1/sqft |
Source: EXIT 1 STOP REALTY #722527 Report a problem | ||
| 2/21/2014 | Sold | $49,500-27.7%$41/sqft |
Source: realMLS #694296 Report a problem | ||
| 12/3/2013 | Listed for sale | $68,500+89.8%$57/sqft |
Source: Prudential Network Realty #694296 Report a problem | ||
| 11/6/2013 | Sold | $36,100-34.4%$30/sqft |
Source: Public Record Report a problem | ||
| 7/22/2011 | Sold | $55,000-54.1%$45/sqft |
Source: Public Record Report a problem | ||
| 12/11/2007 | Sold | $119,900+41.1%$99/sqft |
Source: Public Record Report a problem | ||
| 5/14/2007 | Sold | $85,000$70/sqft |
Source: Public Record Report a problem | ||
Public tax history
| Year | Property taxes | Tax assessment |
|---|---|---|
| 2025 | $2,484 +11.8% | $103,160 +7.3% |
| 2024 | $2,221 +3.8% | $96,104 +10% |
| 2023 | $2,140 +16.4% | $87,368 +10% |
| 2022 | $1,837 +12.4% | $79,426 +10% |
| 2021 | $1,635 +8.2% | $72,206 +10% |
| 2020 | $1,510 +4.1% | $65,642 +10% |
| 2019 | $1,451 +13.7% | $59,675 +10% |
| 2018 | $1,276 | $54,250 -4.6% |
| 2017 | $1,276 +10% | $56,862 +26.5% |
| 2016 | $1,160 | $44,944 +10.3% |
| 2015 | -- | $40,760 +7.5% |
| 2014 | $982 | $37,906 -7.5% |
| 2013 | -- | $40,980 -25.2% |
| 2012 | -- | $54,818 -4.4% |
| 2011 | -- | $57,332 -15.2% |
| 2010 | -- | $67,642 -33.3% |
| 2009 | -- | $101,408 +113.1% |
| 2006 | -- | $47,585 +3% |
| 2005 | $385 | $46,199 +3% |
| 2004 | -- | $44,853 +1.9% |
| 2003 | $359 | $44,017 +2.4% |
| 2002 | -- | $42,985 +1.6% |
| 2001 | -- | $42,308 +3% |
| 2000 | -- | $41,076 +2.7% |
| 1999 | -- | $39,996 |
Find assessor info on the county website
Monthly payment
Est. payment
Payment breakdown
Explore the cost of this home by adjusting the details. Changes won't be saved.Climate risks
Neighborhood: Southside Estates

Similar homes
- $--3 bd1 ba1.2k sqft1834 Cesery Blvd, Jacksonville, FL 32211Auction
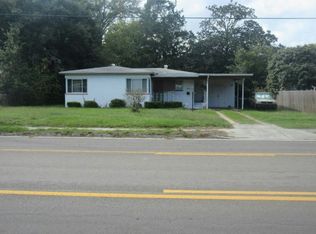 Auction.com 2
- $185,0003 bd1 ba1.1k sqft10259 AGAVE Road, Jacksonville, FL 32246For Sale
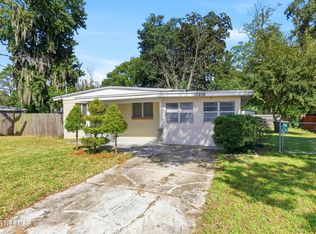 MLS ID #2169726, LILY TRAN. realMLS
- $170,0003 bd1 ba1.1k sqft8021 HARE Avenue, Jacksonville, FL 32211For Sale
 MLS ID #2173140, MICHAEL BRADDOCK. realMLS
- $155,0003 bd1 ba1.1k sqft7302 BERRY AVENUE, JACKSONVILLE, FL 32211For Sale

 MLS ID #TB8565132, Tony Giglio, TOP BROKERAGE, LLC. Stellar MLS
- $135,0002 bd2 ba940 sqft7920 MERRILL Road #305, Jacksonville, FL 32277For Sale
 MLS ID #B26095184, James Distefano, FLORIDA COMMERCIAL ASSET GROUP LLC. BeachesMLS
