Welcome to this spacious 1-story home featuring 4 bedrooms and 2 full bathrooms! The functional floor plan offers comfortable living spaces, including a living room with a fireplace that creates an inviting focal point. Step outside to enjoy the covered patio overlooking the fenced backyard with a storage shed for additional space. Schedule your showing today!
Pending
Price cut: $13K (10/22)
$243,900
1739 Pickering Dr, Reynoldsburg, OH 43068
5beds
1,755sqft
Single Family Residence
Built in 1959
7,840 Square Feet Lot
$-- Zestimate®
$139/sqft
$-- HOA
What's special
Functional floor planInviting focal pointFenced backyardCovered patio
- 41 days
- 1,010
- 116
Likely to sell faster than
Zillow last checked:
Listing updated:
Listed by:
Kelly Rich 336-953-3953,
Mainstay Brokerage LLC
Source: Columbus and Central Ohio Regional MLS ,MLS#: 226036210
Facts & features
Interior
Bedrooms & bathrooms
- Bedrooms: 5
- Bathrooms: 2
- Full bathrooms: 2
- Main level bedrooms: 5
Heating
- Forced Air
Cooling
- Central Air
Appliances
- Included: Dishwasher, Gas Range, Microwave, Refrigerator
Features
- Flooring: Vinyl
- Has fireplace: Yes
- Fireplace features: Wood Burning
- Common walls with other units/homes: No Common Walls
Interior area
- Total structure area: 1,755
- Total interior livable area: 1,755 sqft
Property
Features
- Levels: One
- Patio & porch: Patio
- Fencing: Fenced
Lot
- Size: 7,840 Square Feet
Details
- Additional structures: Shed(s)
- Parcel number: 060002546
Construction
Type & style
- Home type: SingleFamily
- Architectural style: Ranch
- Property subtype: Single Family Residence
Materials
- Foundation: Slab
Condition
- New construction: No
- Year built: 1959
Utilities & green energy
- Sewer: Public Sewer
- Water: Public
Community & HOA
Community
- Subdivision: Huber
HOA
- Has HOA: No
- Amenities included: Sidewalk
Location
- Region: Reynoldsburg
Financial & listing details
- Price per square foot: $139/sqft
- Tax assessed value: $223,800
- Annual tax amount: $4,255
- Date on market: 9/23/2026
- Listing terms: Conventional
Estimated market value
Not available
Estimated sales range
Not available
Not available
Price history
| Date | Event | Price |
|---|---|---|
| 10/28/2026 | Pending sale | $243,900$139/sqft |
Source:  Columbus and Central Ohio Regional MLS #226036210 Report a problem | ||
| 10/22/2026 | Price change | $243,900-5.1%$139/sqft |
Source: Columbus and Central Ohio Regional MLS #226036210 Report a problem | ||
| 10/20/2026 | Price change | $256,900-5.1%$146/sqft |
Source: Columbus and Central Ohio Regional MLS #226036210 Report a problem | ||
| 9/23/2026 | Listed for sale | $270,695+35.3%$154/sqft |
Source: Columbus and Central Ohio Regional MLS #226036210 Report a problem | ||
| 8/28/2026 | Listing removed | $2,010$1/sqft |
Source: Zillow Rentals Report a problem | ||
| 8/26/2026 | Price change | $2,010-6.9%$1/sqft |
Source: Zillow Rentals Report a problem | ||
| 8/17/2026 | Price change | $2,160-0.2%$1/sqft |
Source: Zillow Rentals Report a problem | ||
| 8/10/2026 | Price change | $2,165-3.6%$1/sqft |
Source: Zillow Rentals Report a problem | ||
| 7/27/2026 | Price change | $2,245-4.3%$1/sqft |
Source: Zillow Rentals Report a problem | ||
| 6/9/2026 | Listed for rent | $2,345+21.8%$1/sqft |
Source: Zillow Rentals Report a problem | ||
| 5/27/2023 | Listing removed | -- |
Source: Zillow Rentals Report a problem | ||
| 5/22/2023 | Price change | $1,925-1.5%$1/sqft |
Source: Zillow Rentals Report a problem | ||
| 5/2/2023 | Price change | $1,955+15.7%$1/sqft |
Source: Zillow Rentals Report a problem | ||
| 11/29/2022 | Price change | $1,690-3.4%$1/sqft |
Source: Zillow Rental Network Premium Report a problem | ||
| 11/21/2022 | Price change | $1,750-1.7%$1/sqft |
Source: Zillow Rental Network Premium Report a problem | ||
| 11/14/2022 | Price change | $1,780-2.7%$1/sqft |
Source: Zillow Rental Network Premium Report a problem | ||
| 11/10/2022 | Listed for rent | $1,830+5.8%$1/sqft |
Source: Zillow Rental Network Premium Report a problem | ||
| 3/1/2022 | Listing removed | -- |
Source: Zillow Rental Network Premium Report a problem | ||
| 2/17/2022 | Price change | $1,730-1.1%$1/sqft |
Source: Zillow Rental Network Premium Report a problem | ||
| 2/9/2022 | Price change | $1,750-2%$1/sqft |
Source: Zillow Rental Network Premium Report a problem | ||
| 1/27/2022 | Price change | $1,785-1.1%$1/sqft |
Source: Zillow Rental Network Premium Report a problem | ||
| 1/19/2022 | Price change | $1,805-1.1%$1/sqft |
Source: Zillow Rental Network Premium Report a problem | ||
| 1/13/2022 | Price change | $1,825-1.1%$1/sqft |
Source: Zillow Rental Network Premium Report a problem | ||
| 12/15/2021 | Price change | $1,845-1.6%$1/sqft |
Source: Zillow Rental Network Premium Report a problem | ||
| 12/8/2021 | Listed for rent | $1,875$1/sqft |
Source: Zillow Rental Network Premium Report a problem | ||
| 9/13/2021 | Sold | $200,000+74.1%$114/sqft |
Source: Columbus and Central Ohio Regional MLS #221033077 Report a problem | ||
| 6/6/2005 | Sold | $114,900$65/sqft |
Source: Public Record Report a problem | ||
Public tax history
| Year | Property taxes | Tax assessment |
|---|---|---|
| 2025 | $4,105 -0.1% | $78,330 |
| 2024 | $4,107 +4.6% | $78,330 |
| 2023 | $3,925 -11.3% | $78,330 +17.3% |
| 2022 | $4,424 +40.6% | $66,790 +37.7% |
| 2021 | $3,146 -2% | $48,520 |
| 2020 | $3,210 +10.2% | $48,520 +21.6% |
| 2019 | $2,912 0% | $39,900 |
| 2018 | $2,912 | $39,900 |
| 2017 | $2,912 +7% | $39,900 +19.6% |
| 2016 | $2,723 +3.2% | $33,360 |
| 2015 | $2,638 | $33,360 |
| 2014 | $2,638 +73.8% | $33,360 -15% |
| 2013 | $1,518 -45.5% | $39,270 |
| 2011 | $2,787 -4.4% | $39,270 -9.9% |
| 2010 | $2,916 +14.3% | $43,575 |
| 2008 | $2,551 +10.9% | $43,575 |
| 2007 | $2,300 +1.4% | -- |
| 2006 | $2,268 +1.6% | -- |
| 2005 | $2,234 +11.5% | -- |
| 2004 | $2,004 +4% | -- |
| 2003 | $1,927 -0.2% | -- |
| 2002 | $1,931 +19.2% | -- |
| 2001 | $1,620 -0.7% | -- |
| 2000 | $1,631 | -- |
Find assessor info on the county website
Monthly payment
Est. payment
Payment breakdown
Explore the cost of this home by adjusting the details. Changes won't be saved.Climate risks
Neighborhood: 43068


Similar homes
- $249,9003 bd2 ba1.1k sqft1436 Terry Dr, Reynoldsburg, OH 43068For Sale
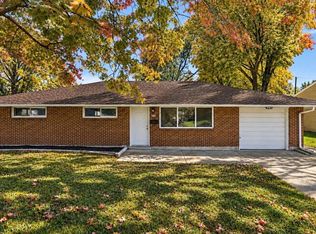
 MLS ID #226040792, Natalay Simakovskay, Key Realty. Columbus and Central Ohio Regional MLS
- $249,9003 bd2 ba1k sqft6580 Red Coach Ln, Reynoldsburg, OH 43068For Sale
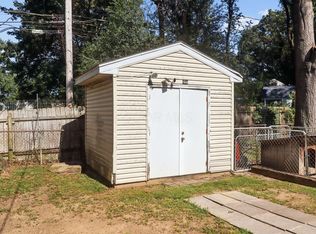 MLS ID #226041597, Cephas Pearson, Red 1 Realty. Columbus and Central Ohio Regional MLS
- $275,0004 bd2 ba1.3k sqft6479 Carriage Ln, Reynoldsburg, OH 43068For Sale
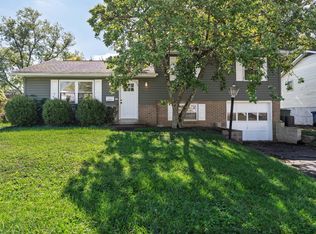 MLS ID #226040663, Corey LaVeris, RE/MAX Affiliates, Inc.. Columbus and Central Ohio Regional MLS
- $244,9004 bd2 ba1.7k sqft6472 Ethan Dr, Reynoldsburg, OH 43068For Sale
 MLS ID #226035820, Eva Marie Hockenberry, Mainstay Brokerage LLC. Columbus and Central Ohio Regional MLS
- $235,0003 bd2 ba1.4k sqft1404 S Waggoner Rd, Reynoldsburg, OH 43068For SaleMLS ID #226036044, Ibrahim B Al-Hejazin, Signature Real Estate. Columbus and Central Ohio Regional MLS
- $216,9003 bd2 ba1.1k sqft6404 E Livingston Ave, Reynoldsburg, OH 43068For SaleMLS ID #226036211, Kelly Rich, Mainstay Brokerage LLC. Columbus and Central Ohio Regional MLS
- $260,0004 bd2 ba1.4k sqft7400 Marlan Ave, Reynoldsburg, OH 43068For SaleMLS ID #226033818, Relindis Asoba, Red 1 Realty. Columbus and Central Ohio Regional MLS
- $219,9003 bd2 ba1.4k sqft6833 Carrousel Dr S, Reynoldsburg, OH 43068For SaleMLS ID #226037576, Beverly J Woodford, Woodford Contemporary. Columbus and Central Ohio Regional MLS
- $257,0003 bd2 ba1.4k sqft2816 Bannon Ct, Reynoldsburg, OH 43068For SaleMLS ID #226038420, Sherrell Erica Butler, e-Merge Real Estate. Columbus and Central Ohio Regional MLS
- $246,5693 bd2 ba1.4k sqft2897 Freedom Trl, Reynoldsburg, OH 43068For SaleMLS ID #226037188, Sam Cooper, Howard Hanna Real Estate Svcs. Columbus and Central Ohio Regional MLS
- $235,0003 bd2 ba1.2k sqft3079 Rumford Ct, Reynoldsburg, OH 43068For SaleMLS ID #226040107, Mary K McMichael, KW Classic Properties Realty. Columbus and Central Ohio Regional MLS
- $268,9003 bd3 ba1.3k sqft6916 Finchley Dr, Reynoldsburg, OH 43068For SaleMLS ID #226040516, William C Hinterschied, Carleton Realty, LLC. Columbus and Central Ohio Regional MLS
- $259,9003 bd2 ba1.3k sqft6608 Benjamin Dr, Reynoldsburg, OH 43068For SaleMLS ID #226034640, Lance E Gordon, Plum Tree Realty. Columbus and Central Ohio Regional MLS
- $265,0003 bd2 ba1.2k sqft6656 Wembley Ct, Reynoldsburg, OH 43068For SaleMLS ID #226034015, Diana Samad, e-Merge Real Estate. Columbus and Central Ohio Regional MLS
- $290,0003 bd2 ba1.4k sqft6431 Blackhaw Dr, Reynoldsburg, OH 43068For SaleMLS ID #226032427, Pradeep Acharya, Howard Hanna Real Estate Svcs. Columbus and Central Ohio Regional MLS
- $239,9002 bd2 ba1.1k sqft7733 Redman Ln, Reynoldsburg, OH 43068For SaleMLS ID #226041328, Wendy Esker, Keller Williams Greater Cols. Columbus and Central Ohio Regional MLS
- $268,5003 bd2 ba1.3k sqft6835 Alexdon Ct, Reynoldsburg, OH 43068For SaleMLS ID #226036960, Paul E J Baker, e-Merge Real Estate. Columbus and Central Ohio Regional MLS
- $237,5003 bd2 ba1.2k sqft3001 Hubbardton Pl, Reynoldsburg, OH 43068For SaleMLS ID #226032825, Vera R Thornhill, Austen Estates, Ltd.. Columbus and Central Ohio Regional MLS
- $179,9006 bd2 ba1.2k sqft6593 Benjamin Dr, Reynoldsburg, OH 43068For SaleMLS ID #226040196, Sahar M Shalash, LRG Realty. Columbus and Central Ohio Regional MLS
