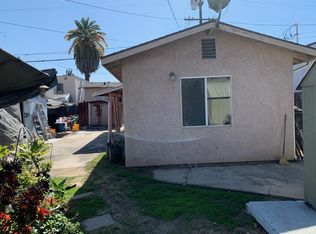
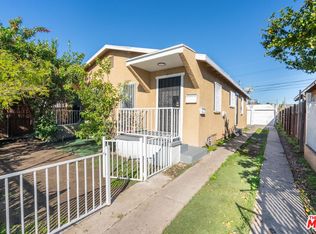
Two detached homes with endless possibilities. Make 1742 W 36th Street your next home or investment in one of Los Angeles' evolving neighborhoods. The front residence was remodeled in 2017 and is move-in ready, an opportunity to generate rental income on day one. The rear unit, following fire damage in the rear unit, remediation work has been completed; the unit is currently GUTTED, creating an opportunity for further evaluation and future improvements.
For sale
$799,000
1742 W 36th St, Los Angeles, CA 90018
5beds
4baths
1,741sqft
Multi Family
Built in 1929
-- sqft lot
$794,900 Zestimate®
$459/sqft
$-- HOA
What's special
- 27 days
- 676
- 54
Zillow last checked:
Listing updated:
Listed by:
Juan Longfellow DRE # 01513675 310-920-3019,
Compass 310-593-6999,
Louise Leach DRE # 01774966 213-344-8090,
Compass
Source: CLAW,MLS#: 26103817
Facts & features
Interior
Bedrooms & bathrooms
- Bedrooms: 5
- Bathrooms: 4
Heating
- Wall
Cooling
- Wall/Window Unit(s)
Appliances
- Included: Refrigerator, Range/Oven
Interior area
- Total structure area: 1,741
- Total interior livable area: 1,741 sqft
Property
Parking
- Parking features: On Street
- Has uncovered spaces: Yes
Features
- Levels: One
- View description: None
Lot
- Size: 4,173 Square Feet
Details
- Additional structures: None
- Parcel number: 5041014013
- Zoning: LAR2
- Special conditions: Standard
Construction
Type & style
- Home type: MultiFamily
- Architectural style: California Bungalow
- Property subtype: Multi Family
Condition
- Year built: 1929
Community & HOA
Location
- Region: Los Angeles
Financial & listing details
- Price per square foot: $459/sqft
- Tax assessed value: $728,206
- Date on market: 10/21/2026
Estimated market value
$794,900
$755,000 - $835,000
$2,281/mo
Price history
| Date | Event | Price |
|---|---|---|
| 10/21/2026 | Listed for sale | $799,000-15.8%$459/sqft |
Source:  CLAW #26103817 Report a problem | ||
| 10/20/2026 | Listing removed | $949,000$545/sqft |
Source: CLAW #26832329 Report a problem | ||
| 10/14/2026 | Listed for sale | $949,000$545/sqft |
Source: CLAW #26832329 Report a problem | ||
| 9/15/2026 | Listing removed | $949,000$545/sqft |
Source: CLAW #26832329 Report a problem | ||
| 8/15/2026 | Listed for sale | $949,000$545/sqft |
Source: CLAW #26832329 Report a problem | ||
| 7/16/2026 | Listing removed | $949,000$545/sqft |
Source: CLAW #26832329 Report a problem | ||
| 5/11/2026 | Listed for sale | $949,000+1.4%$545/sqft |
Source: CLAW #26832329 Report a problem | ||
| 1/31/2026 | Listing removed | $936,000$538/sqft |
Source: CLAW #25595669 Report a problem | ||
| 9/22/2025 | Listed for sale | $936,000-1.4%$538/sqft |
Source: CLAW #25595669 Report a problem | ||
| 9/22/2025 | Listing removed | $949,000$545/sqft |
Source: CLAW #25524494 Report a problem | ||
| 4/11/2025 | Listed for sale | $949,000-4.6%$545/sqft |
Source: CLAW #25524494 Report a problem | ||
| 11/13/2024 | Listing removed | $995,000$572/sqft |
Source: CLAW #24-418731 Report a problem | ||
| 7/24/2024 | Listed for sale | $995,000+55.5%$572/sqft |
Source: CLAW #24-418731 Report a problem | ||
| 4/28/2017 | Sold | $640,000+3.4%$368/sqft |
Source:  CLAW #17211540 Report a problem | ||
| 3/23/2017 | Pending sale | $619,000$356/sqft |
Source: Figure 8 Realty #17211540 Report a problem | ||
| 3/16/2017 | Listed for sale | $619,000+48.6%$356/sqft |
Source: Figure 8 Realty #17211540 Report a problem | ||
| 2/19/2017 | Listing removed | $2,695$2/sqft |
Source: Figure 8 PM, Inc. Report a problem | ||
| 2/14/2017 | Listed for rent | $2,695$2/sqft |
Source: Figure 8 PM, Inc. Report a problem | ||
| 5/25/2016 | Sold | $416,500+60.2%$239/sqft |
Source: Public Record Report a problem | ||
| 5/11/2012 | Sold | $260,000-38.3%$149/sqft |
Source: CLAW #12582131 Report a problem | ||
| 5/17/2011 | Sold | $421,719+8334.4%$242/sqft |
Source: Public Record Report a problem | ||
| 8/20/1996 | Sold | $5,000$3/sqft |
Source: Public Record Report a problem | ||
Public tax history
| Year | Property taxes | Tax assessment |
|---|---|---|
| 2026 | -- | $757,624 +2% |
| 2025 | $9,070 +1% | $742,769 +2% |
| 2024 | $8,979 +1.9% | $728,206 +2% |
| 2023 | $8,809 +4.8% | $713,928 +2% |
| 2022 | $8,404 +1.3% | $699,930 +2% |
| 2021 | $8,299 -1% | $686,207 +1% |
| 2020 | $8,384 | $679,172 +2% |
| 2019 | $8,384 +5.1% | $665,856 +2% |
| 2018 | $7,974 | $652,800 +53.8% |
| 2017 | $7,974 +52.5% | $424,320 +53.8% |
| 2016 | $5,229 +55.8% | $275,868 +1.5% |
| 2015 | $3,356 +0.8% | $271,725 +2% |
| 2014 | $3,330 | $266,403 +168.7% |
| 2011 | -- | $99,145 +0.8% |
| 2010 | -- | $98,405 -84.2% |
| 2009 | -- | $624,240 +2% |
| 2008 | -- | $612,000 +545.5% |
| 2007 | -- | $94,811 -36.1% |
| 2006 | -- | $148,373 |
| 2005 | -- | $148,373 +6% |
| 2003 | -- | $140,000 |
Find assessor info on the county website
Monthly payment
Est. payment
Payment breakdown
Explore the cost of this home by adjusting the details. Changes won't be saved.Climate risks
Neighborhood: South Los Angeles
Similar homes
- $790,0003 bd2 ba1.1k sqft3414 S Gramercy Pl, Los Angeles, CA 90018For Sale
 MLS ID #26103405, Jason Lee DRE # 01845646, Team Spirit Realty. CLAW
- $795,0007 bd4 ba2.1k sqft208 W 49th St, Los Angeles, CA 90037For Sale
 MLS ID #26985103, Christopher Ryder DRE # 02007962, Compass. CLAW
- $775,0004 bd4 ba2k sqft901 E 42nd St, Los Angeles, CA 90011For Sale
 MLS ID #26853587, Shavarsh Alajajyan DRE # 01490112, Real Brokerage Technologies. CLAW
- $749,0006 bd3 ba1.9k sqft341 E 71st St, Los Angeles, CA 90003For Sale
 MLS ID #26839027, Moises Arroyo DRE # 01853838, The Core Agency. CLAW
