1753 Ruth Dr, Ripon, CA 95366 is a single family home that contains 2,618 sq ft and was built in 2000. It contains 6 bedrooms and 3 bathrooms. This home last sold for $651,000 in June 2026.
The Zestimate for this house is $785,100. The Rent Zestimate for this home is $3,915/mo.
Sold for $651,000
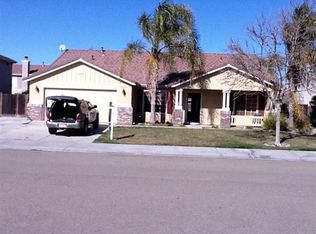
Street View
$651,000
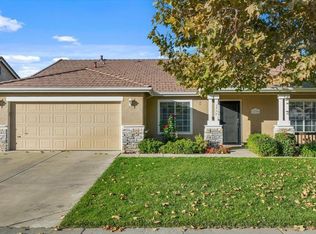
1753 Ruth Dr, Ripon, CA 95366
6beds
3baths
2,618sqft
SingleFamily
Built in 2000
7,187 Square Feet Lot
$785,100 Zestimate®
$249/sqft
$3,915 Estimated rent
Home value
$785,100
$746,000 - $824,000
$3,915/mo
Zestimate® history
Owner options
List your home for rent
$3,915/mo
Rent Zestimate®
Find your next renter with Zillow Rental Manager. Plus, with online applications, you can quickly screen prospective tenants – for free.
$3,915/mo
Rent Zestimate®
Refinance and save
$4,167/mo
Est. payment
Refinancing to a lower rate could help reduce your monthly payments and save thousands over the life of the loan.
$4,167/mo
Est. payment
Explore your selling options
Work with a Zillow partner agent
Leverage their expertise and Zillow's premium Showcase listings to get your home seen by more buyers.
Get startedList with your own agent
Get your home in front of millions of buyers by listing it on Zillow.
Learn how to do itSell it yourself
Take full control of how buyers see your home on Zillow by listing For Sale by Owner (FSBO).
List your homeWhat's special
Facts & features
Interior
Bedrooms & bathrooms
- Bedrooms: 6
- Bathrooms: 3
Heating
- Other
Cooling
- Central
Interior area
- Total interior livable area: 2,618 sqft
Property
Parking
- Total spaces: 2
Lot
- Size: 7,187 Square Feet
Details
- Parcel number: 257370610000
Construction
Type & style
- Home type: SingleFamily
Materials
- wood frame
Condition
- Year built: 2000
Community & HOA
Location
- Region: Ripon
Financial & listing details
- Price per square foot: $249/sqft
- Tax assessed value: $532,702
- Annual tax amount: $5,709
Price history
| Date | Event | Price |
|---|---|---|
| 6/11/2026 | Sold | $651,000+44.7%$249/sqft |
Source: Public Record Report a problem | ||
| 7/16/2015 | Sold | $450,000+23.3%$172/sqft |
Source: MetroList Services of CA #15034342 Report a problem | ||
| 4/16/2015 | Sold | $365,000-11.6%$139/sqft |
Source: MetroList Services of CA #15013324 Report a problem | ||
| 12/11/2014 | Sold | $412,682+74.1%$158/sqft |
Source: Public Record Report a problem | ||
| 1/23/2001 | Sold | $237,000$91/sqft |
Source: Public Record Report a problem | ||
Public tax history
| Year | Property taxes | Tax assessment |
|---|---|---|
| 2025 | $5,709 +1.7% | $532,702 +2% |
| 2024 | $5,614 +2.1% | $522,258 +2% |
| 2023 | $5,498 +1.6% | $512,018 +2% |
| 2022 | $5,409 +1.6% | $501,980 +2% |
| 2021 | $5,324 +0.9% | $492,139 +1% |
| 2020 | $5,274 +1.8% | $487,093 +2% |
| 2019 | $5,182 +1.6% | $477,543 +2% |
| 2018 | $5,100 +1.7% | $468,180 +2% |
| 2017 | $5,014 +0.5% | $459,000 +2% |
| 2016 | $4,990 +47.7% | $450,000 +23.3% |
| 2015 | $3,379 | $365,000 +18.2% |
| 2014 | $3,379 | $308,790 +8.3% |
| 2013 | -- | $285,000 +8% |
| 2012 | -- | $264,000 -10.6% |
| 2011 | -- | $295,460 +0.8% |
| 2010 | -- | $293,254 -0.2% |
| 2009 | -- | $293,952 +2% |
| 2008 | -- | $288,189 +2% |
| 2007 | -- | $282,540 +2% |
| 2006 | -- | $277,000 +2% |
| 2005 | -- | $271,569 +2% |
| 2004 | -- | $266,245 +8.1% |
| 2003 | -- | $246,367 +4% |
| 2002 | -- | $236,800 +533.4% |
| 2001 | -- | $37,388 |
Find assessor info on the county website
Neighborhood: 95366
Nearby homes
- $690,4004 bd2 ba2.2k sqft1743 Ruth Dr, Ripon, CA 95366Off Market
- $665,0004 bd2 ba2.2k sqft1775 Ruth Dr, Ripon, CA 95366Sold
- $819,0005 bd3 ba3k sqft1758 Melissa Dr, Ripon, CA 95366Off Market
- $684,9005 bd2 ba2.2k sqft1772 Melissa Dr, Ripon, CA 95366Off Market
- $713,0004 bd2 ba2.2k sqft1740 Melissa Dr, Ripon, CA 95366Off Market
- $846,2005 bd3 ba3k sqft1737 Ruth Dr, Ripon, CA 95366Off Market
- $693,9004 bd2 ba2.2k sqft1797 Ruth Dr, Ripon, CA 95366Off Market
- $769,1004 bd2 ba2.2k sqft1752 Ruth Dr, Ripon, CA 95366Off Market
Nearby schools
GreatSchools rating
- 8/10Weston Elementary SchoolGrades: K-8Distance: 0.2 mi
- NAHarvest HighGrades: 9-12Distance: 0.9 mi
- 9/10Ripon Elementary SchoolGrades: K-8Distance: 1 mi
Get a cash offer in 3 minutes
Find out how much your home could sell for in as little as 3 minutes with a no-obligation cash offer.
Estimated market value
$785,100
Get a cash offer in 3 minutes
Find out how much your home could sell for in as little as 3 minutes with a no-obligation cash offer.
Estimated market value
$785,100
- California
- San Joaquin County
- Ripon
- 95366
- 1753 Ruth Dr
Nearby cities
Nearby zip codes
Other Ripon Topics
