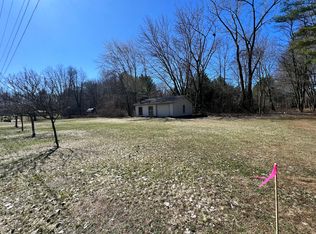
Country home on over just 2.5 acres. Home sits back off the road. 2 bedrooms, 1 bathrooms. The home is ready for a few more renovations to make this a perfect home just outside of downtown Nunica. The property include a barn for storage and workshop potential.
Active
$260,000
17655 112th Ave, Nunica, MI 49448
2beds
1,410sqft
Single Family Residence
Built in 1943
2.53 Acres Lot
$240,000 Zestimate®
$184/sqft
$-- HOA
What's special
Barn for storage
- 30 days
- 3,417
- 211
Zillow last checked:
Listing updated:
Listed by:
Derick Carini 616-510-0549,
Carini & Associates Realtors 616-393-0444
Source: MichRIC,MLS#: 26054024
Facts & features
Interior
Bedrooms & bathrooms
- Bedrooms: 2
- Bathrooms: 1
- Full bathrooms: 1
- Main level bedrooms: 2
Heating
- Forced Air
Appliances
- Included: Range, Refrigerator
- Laundry: In Basement
Features
- Basement: Full
- Has fireplace: No
Interior area
- Total structure area: 1,410
- Total interior livable area: 1,410 sqft
- Finished area below ground: 0
Video & virtual tour
Property
Parking
- Total spaces: 2
- Parking features: Detached
- Garage spaces: 2
Features
- Stories: 2
Lot
- Size: 2.53 Acres
- Dimensions: 328 x 400
Details
- Parcel number: 700410400008
Construction
Type & style
- Home type: SingleFamily
- Architectural style: Cape Cod,Farmhouse
- Property subtype: Single Family Residence
Materials
- Vinyl Siding
- Roof: Asphalt,Shingle
Condition
- New construction: No
- Year built: 1943
Utilities & green energy
- Sewer: Septic Tank
- Water: Public, Well
Community & HOA
Location
- Region: Nunica
Financial & listing details
- Price per square foot: $184/sqft
- Tax assessed value: $62,983
- Annual tax amount: $1,886
- Date on market: 10/9/2026
- Listing terms: Cash,FHA,VA Loan,USDA Loan,MSHDA,Conventional
Estimated market value
$240,000
$228,000 - $252,000
$1,585/mo
Price history
| Date | Event | Price |
|---|---|---|
| 10/9/2026 | Listed for sale | $260,000$184/sqft |
Source:  MichRIC #26054024 Report a problem | ||
Public tax history
| Year | Property taxes | Tax assessment |
|---|---|---|
| 2025 | $1,787 +10.6% | $61,328 +3.1% |
| 2024 | $1,616 +5% | $59,484 +5% |
| 2023 | $1,539 +459.7% | $56,652 |
| 2022 | $275 | -- |
| 2021 | -- | -- |
| 2020 | -- | $51,511 +4.3% |
| 2018 | -- | $49,367 -26.9% |
| 2017 | -- | $67,500 -1.5% |
| 2016 | -- | $68,500 +7.7% |
| 2015 | -- | $63,600 +1.4% |
| 2014 | -- | $62,700 +3% |
| 2013 | -- | $60,900 +1.7% |
| 2012 | -- | $59,900 +1.2% |
| 2011 | -- | $59,200 -9.8% |
| 2009 | -- | $65,600 -10% |
| 2008 | -- | $72,900 +11.6% |
| 2005 | -- | $65,300 +3.2% |
| 2004 | -- | $63,300 +6.2% |
| 2003 | -- | $59,600 +8% |
| 2002 | -- | $55,200 +12.4% |
| 2001 | -- | $49,100 |
Find assessor info on the county website
Monthly payment
Est. payment
Payment breakdown
Explore the cost of this home by adjusting the details. Changes won't be saved.Climate risks
Neighborhood: 49448
Similar homes
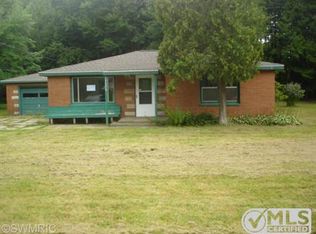
- $279,9003 bd1 ba1.9k sqft11665 Apple Dr, Nunica, MI 49448For Sale
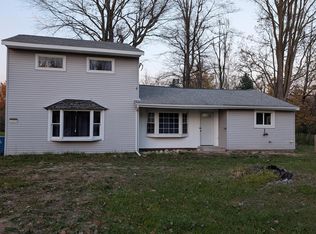
 MLS ID #26058114, Grace Suchowian, Platinum Realty Lake Michigan. MichRIC
- $259,9003 bd1 ba1.4k sqft14231 State Rd, Nunica, MI 49448For Sale
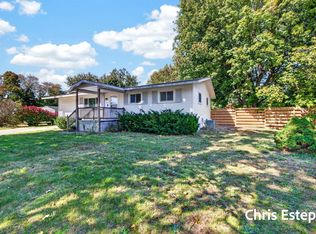 MLS ID #26053465, Christine Gerling, Greenridge Realty. MichRIC
- $339,0002 bd1 ba1.2k sqft18130 112th Ave, Nunica, MI 49448For Sale
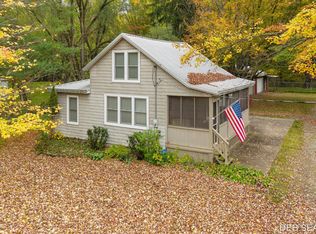 MLS ID #26056604, Deborah R Sears, Coldwell Banker Schmidt Realtors. MichRIC
- $260,0003 bd2 ba1.4k sqft13480 Hickory Rd, Fruitport, MI 49415For Sale
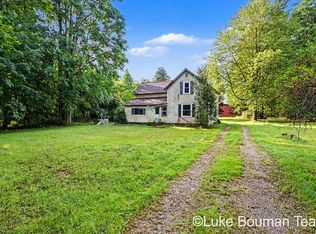 MLS ID #26047833, Luke Scott Bouman, HomeRealty Holland. MichRIC
- $279,9004 bd2 ba1.6k sqft15469 Pruin St, Spring Lake, MI 49456For SaleMLS ID #26057157, Steven S Schuitema, Greenridge - Nexes. MichRIC
- $279,0003 bd2 ba1.6k sqft1972 S Maple Island Rd, Muskegon, MI 49442For SaleMLS ID #26055358, Jenna Pope, Coldwell Banker Woodland Schmidt Grand Haven. MichRIC
- $269,9002 bd1 ba790 sqft413 N 6th St, Grand Haven, MI 49417For SaleMLS ID #26059043, Angela Bruursema, RE/MAX West. MichRIC
- $269,9002 bd1 ba964 sqft201 S Albee St, Grand Haven, MI 49417For SaleMLS ID #26058802, Tammy Jo Budzynski, Keller Williams GR North. MichRIC
- $279,9003 bd1 ba1k sqft15246 Krueger St, Spring Lake, MI 49456For SaleMLS ID #26055845, Tammy Sue Halterman, Five Star Real Estate. MichRIC
- $245,0005 bd2 ba2k sqft374 N 6th Ave, Fruitport, MI 49415For SaleMLS ID #26056523, David Medendorp, Medendorp Real Estate Group. MichRIC
- $322,5003 bd2 ba1.5k sqft260 Church St, Coopersville, MI 49404For SaleMLS ID #26058808, Jody Schwalm, RE/MAX United (Beltline). MichRIC
- $239,9003 bd2 ba1.6k sqft404 Park St, Coopersville, MI 49404For SaleMLS ID #26050522, Skylar Grimm, Greenridge Realty. MichRIC
- $320,0003 bd2 ba1.3k sqft3266 Mark Ave, Muskegon, MI 49444For Sale
 MLS ID #20261089007, Daniel Beirne, OpenDoor Brokerage LLC. Realcomp II
- $309,0004 bd2 ba1.3k sqft2150 S Maple Island Rd, Muskegon, MI 49442For SaleMLS ID #26056148, Ricardo S Cottengim, Cody and Co.. MichRIC
- $240,0003 bd1 ba1k sqft4341 Brewer St, Muskegon, MI 49444For SaleMLS ID #26057658, Jamie S Rogers, Bellabay Realty LLC. MichRIC
- $279,9003 bd1 ba1.2k sqft615 Fall St, Spring Lake, MI 49456For SaleMLS ID #26049497, Mark D Gleason, Coldwell Banker Woodland Schmidt Grand Haven. MichRIC
- $349,9002 bd3 ba1.9k sqft17097 Arthur Ct #34, Spring Lake, MI 49456For SaleMLS ID #26059124, Courtney R Gabridge, Five Star Real Estate (Ada). MichRIC
- $305,0004 bd1 ba1.6k sqft13379 68th Ave, Allendale, MI 49401For SaleMLS ID #26053568, James S Shull, Five Star Real Estate (Main). MichRIC
- $279,9003 bd1 ba1.1k sqft18452 168th Ave, Spring Lake, MI 49456For SaleMLS ID #26040347, Lorie Kiebach, Greenridge Realty. MichRIC
