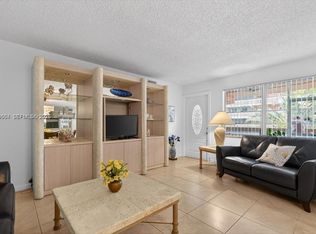
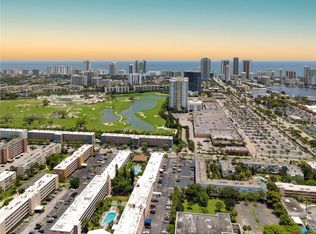
Fantastic investment opportunity featuring a lovely and spacious condo. Perfectly situated in an incredible location close to the beach, Gulfstream Park Racetrack, and Casino. Residents will enjoy excellent community amenities, including a beautiful pool and clubhouse. The property is currently rented at $1,550 per month, with the tenant in place through June 30, 2027.
For sale
$149,000
180 NE 12th Ave APT 14D, Hallandale, FL 33009
1beds
660sqft
Condominium
Built in 1967
-- sqft lot
$-- Zestimate®
$226/sqft
$790/mo HOA
What's special
Beautiful poolLovely and spacious condo
- 8 days
- 85
- 0
Likely to sell faster than
Zillow last checked:
Listing updated:
Listed by:
Giovana Longman 786-326-6888,
Beachfront Realty Inc
Source: MIAMI,MLS#: A12114718 Originating MLS: A-Miami Association of REALTORS
Facts & features
Interior
Bedrooms & bathrooms
- Bedrooms: 1
- Bathrooms: 1
- Full bathrooms: 1
Heating
- None
Cooling
- Central Air
Appliances
- Included: Electric Range, Refrigerator
Features
- Other
- Flooring: Tile
Interior area
- Total structure area: 660
- Total interior livable area: 660 sqft
Video & virtual tour
Property
Parking
- Parking features: 1 Space, Assigned, Guest
Features
- Patio & porch: Screened Porch
- Pool features: Association
- Has view: Yes
- View description: Pool
Lot
- Features: East Of Us1
Details
- Parcel number: 514227BB0720
Construction
Type & style
- Home type: Condo
- Property subtype: Condominium
- Attached to another structure: Yes
Materials
- CBS Construction
Condition
- Year built: 1967
Community & HOA
Community
- Security: Complex Fenced
- Application fee: $200
- Subdivision: Eldorado Plaza West Condo
HOA
- Has HOA: Yes
- Amenities included: Clubhouse-Clubroom, Laundry, Elevator(s), Pool, Shuffleboard Court
- HOA fee: $790 monthly
Location
- Region: Hallandale
Financial & listing details
- Price per square foot: $226/sqft
- Tax assessed value: $135,230
- Annual tax amount: $3,049
- Date on market: 10/28/2026
- Listing terms: All Cash,Conventional
Estimated market value
Not available
Estimated sales range
Not available
Not available
Price history
| Date | Event | Price |
|---|---|---|
| 10/29/2026 | Listed for sale | $149,000+2.8%$226/sqft |
Source:  MIAMI #A12114718 Report a problem | ||
| 5/28/2026 | Listing removed | $1,550$2/sqft |
Source: MIAMI #A11969915 Report a problem | ||
| 5/13/2026 | Price change | $1,550-3.1%$2/sqft |
Source: MIAMI #A11969915 Report a problem | ||
| 4/15/2026 | Price change | $1,600-3%$2/sqft |
Source: MIAMI #A11969915 Report a problem | ||
| 4/6/2026 | Listed for rent | $1,650$3/sqft |
Source: MIAMI #A11969915 Report a problem | ||
| 3/3/2026 | Listing removed | $1,650$3/sqft |
Source: MIAMI #A11969915 Report a problem | ||
| 2/22/2026 | Listed for rent | $1,650$3/sqft |
Source: MIAMI #A11969915 Report a problem | ||
| 6/17/2023 | Listing removed | -- |
Source: MIAMI #A11350056 Report a problem | ||
| 6/7/2023 | Price change | $1,650-1.8%$3/sqft |
Source: MIAMI #A11350056 Report a problem | ||
| 5/25/2023 | Price change | $1,680-1.2%$3/sqft |
Source: MIAMI #A11350056 Report a problem | ||
| 5/19/2023 | Price change | $1,700+1.2%$3/sqft |
Source: MIAMI #A11350056 Report a problem | ||
| 5/5/2023 | Price change | $1,680-1.2%$3/sqft |
Source: MIAMI #A11350056 Report a problem | ||
| 3/2/2023 | Listed for rent | $1,700+61.9%$3/sqft |
Source: MIAMI #A11350056 Report a problem | ||
| 5/9/2022 | Sold | $145,000$220/sqft |
Source: Public Record Report a problem | ||
| 1/7/2022 | Sold | $145,000$220/sqft |
Source: MIAMI #A11123968 Report a problem | ||
| 12/1/2021 | Pending sale | $145,000$220/sqft |
Source:  Douglas Elliman #A11123968 Report a problem | ||
| 12/1/2021 | Contingent | $145,000$220/sqft |
Source: MIAMI #A11123968 Report a problem | ||
| 11/18/2021 | Listed for sale | $145,000+49.6%$220/sqft |
Source: MIAMI #A11123968 Report a problem | ||
| 4/2/2017 | Listing removed | $1,050$2/sqft |
Source: InvestPro Properties Inc #RX-10307988 Report a problem | ||
| 3/14/2017 | Price change | $1,050-4.1%$2/sqft |
Source: InvestPro Properties Inc #RX-10307988 Report a problem | ||
| 3/1/2017 | Price change | $1,095-0.5%$2/sqft |
Source: InvestPro Properties Inc #RX-10307988 Report a problem | ||
| 2/22/2017 | Price change | $1,100-7.9%$2/sqft |
Source: InvestPro Properties Inc #RX-10307988 Report a problem | ||
| 2/14/2017 | Listed for rent | $1,195+8.6%$2/sqft |
Source: InvestPro Properties Inc #RX-10307988 Report a problem | ||
| 6/2/2016 | Listing removed | $1,100$2/sqft |
Source: Hollywood Homes Real Estate Report a problem | ||
| 2/20/2016 | Listing removed | $96,900$147/sqft |
Source: Coldwell Banker Residential Real Estate #A10022579 Report a problem | ||
| 1/26/2016 | Listed for sale | $96,900+50.2%$147/sqft |
Source: Coldwell Banker Residential Real Estate - Weston #A10022579 Report a problem | ||
| 8/15/2012 | Sold | $64,500-57%$98/sqft |
Source: Public Record Report a problem | ||
| 10/4/2005 | Sold | $150,000+233.3%$227/sqft |
Source: Public Record Report a problem | ||
| 3/22/2002 | Sold | $45,000+12.5%$68/sqft |
Source: Public Record Report a problem | ||
| 11/1/1993 | Sold | $40,000$61/sqft |
Source: Public Record Report a problem | ||
Public tax history
| Year | Property taxes | Tax assessment |
|---|---|---|
| 2025 | $3,143 +1.4% | $135,230 +2.7% |
| 2024 | $3,101 -6.2% | $131,730 -5.8% |
| 2023 | $3,308 +57.7% | $139,880 +64.8% |
| 2022 | $2,098 +13.4% | $84,870 +10% |
| 2021 | $1,850 -1.3% | $77,160 -1.1% |
| 2020 | $1,875 0% | $78,040 +0.5% |
| 2019 | $1,876 | $77,620 +5.1% |
| 2018 | $1,876 +9.6% | $73,860 -9.9% |
| 2017 | $1,711 -2.9% | $82,000 +10% |
| 2016 | $1,761 +3.3% | $74,550 +10% |
| 2015 | $1,705 +15.5% | $67,780 +10% |
| 2014 | $1,477 | $61,620 +10% |
| 2013 | $1,477 +16.9% | $56,020 +1.4% |
| 2012 | $1,263 +2.8% | $55,220 +3% |
| 2011 | $1,228 +67.8% | $53,620 -9.3% |
| 2010 | $732 -11% | $59,120 -18.9% |
| 2009 | $822 -66.5% | $72,870 -38.3% |
| 2008 | $2,451 | $118,080 |
Find assessor info on the county website
Monthly payment
Est. payment
Payment breakdown
Explore the cost of this home by adjusting the details. Changes won't be saved.Climate risks
Neighborhood: 33009
- $1,5001 bd1 ba660 sqft180 NE 12th Ave APT 12A, Hallandale Beach, FL 33009For Rent

- $239,0002 bd2 ba1.2k sqft180 NE 12th Ave APT 17A, Hallandale, FL 33009For Sale

- $135,0001 bd1 ba660 sqft180 NE 12th Ave APT 15B, Hallandale, FL 33009Sold
- $238,0002 bd2 ba1.1k sqft180 NE 12th Ave APT 18C, Hallandale, FL 33009For Sale
Similar homes
- $159,5001 bd1 ba640 sqft17th Green Condo, Hallandale, FL 33009For Sale

 MLS ID #A12067975, Fernando Avila, Fernando Avila R.E Broker. MIAMI
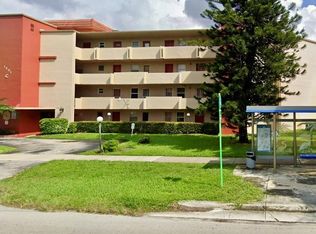
- $149,0001 bd2 ba898 sqftRolling Green Condo C, Miami, FL 33179For Sale
 MLS ID #A12113997, Jessica Buitrago, Fathom Realty FL, LLC. MIAMI
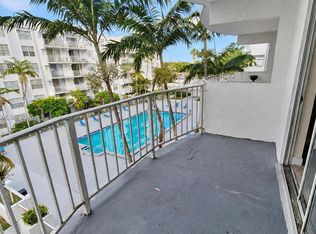
- $139,0001 bd1 ba826 sqftMontecarlo Condo, Miami Gardens, FL 33169For Sale
 MLS ID #A12114022, Yelba Davila, Casabella Miami Realty. MIAMI
- $150,0001 bd1 ba576 sqftCypress Gardens Condo, Hollywood, FL 33020For Sale
 MLS ID #A11998197, Silvia Edery PA, La Rosa Realty Beaches LLC. MIAMI
- $144,9901 bd1 ba658 sqftTall Trees Condo, North Miami Beach, FL 33160For SaleMLS ID #A12098231, Valeria Rodriguez, SIR Realty LLC. MIAMI
- $182,0001 bd1 ba750 sqftCasa Paradiso, Hallandale, FL 33009For SaleMLS ID #A11998659, Nathalie Rousseau, Keyes Company. MIAMI
- $150,0002 bd2 ba937 sqftSanta Monica Condominium, Hollywood, FL 33020For SaleMLS ID #A12069749, Samuel Birch, Brokers, LLC. MIAMI
- $140,0001 bd1 ba640 sqftTown Colony Condo, Hollywood, FL 33020For SaleMLS ID #A12036908, Diego Kogutek, Horizon Homes Realty Corp. MIAMI
- $210,0002 bd2 ba924 sqftDesoto, Hallandale, FL 33009For SaleMLS ID #A12003956, Sergio Kaplan, Carden Realty & Investment Inc. MIAMI
- $140,0001 bd1 ba640 sqftTown Colony Condo, Hollywood, FL 33020For SaleMLS ID #A11941974, Ilbania Gomez Suarez, Faith International Real Estate. MIAMI
- $169,9901 bd2 ba898 sqftPrinceton Condominium, Hollywood, FL 33020For SaleMLS ID #A12091026, Silvia Lorse, RE/MAX 5 Star Realty. MIAMI
- $163,0001 bd1 ba530 sqftThe Palms 51 Condo, North Miami Beach, FL 33162For SaleMLS ID #A12093933, Lucy Rojas, Keller Williams Realty International Lifestyles. MIAMI
- $174,9991 bd2 ba741 sqftEnsenada Condo, Miami, FL 33180For SaleMLS ID #A12069357, Lana Levitina, Coldwell Banker Realty. MIAMI
- $135,0001 bd2 ba750 sqftCaribbean House, North Miami Beach, FL 33160For SaleMLS ID #A12084169, Zoila Zamora, United Realty Group Inc. MIAMI
- $170,0001 bd1 ba581 sqftMadison Condo, Hollywood, FL 33020For SaleMLS ID #A12071972, Harold Neale, Neale Real Estate Company. MIAMI
- $170,0001 bd1 ba581 sqftMadison Condo, Hollywood, FL 33020For SaleMLS ID #A12071955, Harold Neale, Neale Real Estate Company. MIAMI
- $149,0001 bd2 ba921 sqftFifth Moorings Condo, Miami, FL 33179For SaleMLS ID #A12033162, Maria Ktori, Coldwell Banker Realty. MIAMI
- $155,0001 bd1 ba590 sqftLakeview Of The Calf Club, Miami, FL 33179For SaleMLS ID #A11984075, Dario Perez, Realty One Group Evolution. MIAMI
- $160,0001 bd1 ba768 sqftPoint East Condominium, Aventura, FL 33160For SaleMLS ID #A11985087, Graziella Pincetti, Beachfront Realty Inc. MIAMI
- $155,0001 bd2 ba785 sqftEllington At County Line, Miami Gardens, FL 33169For SaleMLS ID #A12079493, Amalia Ahumada, Costa Miami Realty, LLC. MIAMI
