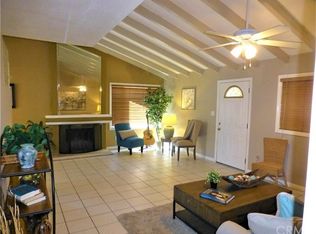
This 1096 square foot single family home has 3 bedrooms and 2.0 bathrooms. This home is located at 1813 W Robin Rd, Orange, CA 92868.
Pre-foreclosure
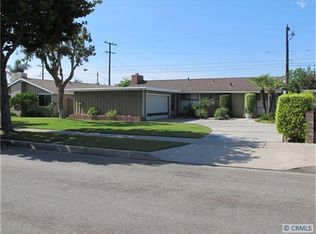
Street View
Est. $957,300
1813 W Robin Rd, Orange, CA 92868
3beds
2baths
1,096sqft
SingleFamily
Built in 1955
6,076 Square Feet Lot
$957,300 Zestimate®
$873/sqft
$-- HOA
Overview
- 253 days |
- 16 |
- 1 |
Facts & features
Interior
Bedrooms & bathrooms
- Bedrooms: 3
- Bathrooms: 2
Interior area
- Total interior livable area: 1,096 sqft
Property
Parking
- Parking features: Garage - Attached
Lot
- Size: 6,076 Square Feet
Details
- Parcel number: 39024119
Construction
Type & style
- Home type: SingleFamily
Condition
- Year built: 1955
Community & HOA
Location
- Region: Orange
Financial & listing details
- Price per square foot: $873/sqft
- Tax assessed value: $710,887
- Annual tax amount: $7,860
Visit our professional directory to find a foreclosure specialist in your area that can help with your home search.
Find a foreclosure agentForeclosure details
Estimated market value
$957,300
$909,000 - $1.01M
$4,139/mo
Price history
| Date | Event | Price |
|---|---|---|
| 5/12/2004 | Sold | $500,000+49.3%$456/sqft |
Source: Public Record Report a problem | ||
| 8/5/2003 | Sold | $335,000$306/sqft |
Source: Public Record Report a problem | ||
Public tax history
| Year | Property taxes | Tax assessment |
|---|---|---|
| 2025 | $7,860 +2.3% | $710,887 +2% |
| 2024 | $7,686 +2.3% | $696,949 +2% |
| 2023 | $7,517 +6.6% | $683,284 +6.8% |
| 2022 | $7,050 +2.9% | $639,540 +2% |
| 2021 | $6,851 +9.5% | $627,000 +10% |
| 2020 | $6,260 | $570,180 +2% |
| 2019 | $6,260 +1.3% | $559,000 |
| 2018 | $6,180 +2.1% | $559,000 |
| 2017 | $6,055 | $559,000 +21.8% |
| 2016 | $6,055 +20.7% | $459,000 +10.3% |
| 2015 | $5,017 +19% | $416,000 +8.5% |
| 2014 | $4,218 | $383,328 +21% |
| 2013 | -- | $316,800 |
| 2012 | -- | $316,800 -4% |
| 2011 | -- | $330,000 |
| 2010 | -- | $330,000 |
| 2009 | -- | $330,000 -34.3% |
| 2008 | -- | $502,000 -5.4% |
| 2007 | -- | $530,604 +2% |
| 2006 | -- | $520,200 +2% |
| 2005 | -- | $510,000 +363.6% |
| 2004 | -- | $109,997 +1.9% |
| 2003 | -- | $107,981 +2% |
| 2002 | -- | $105,864 +2% |
| 2001 | $1,067 +2.1% | $103,789 +2% |
| 2000 | $1,046 | $101,754 |
Find assessor info on the county website
Monthly payment
Estimated monthly payment$1,822
All calculations are estimates and provided by Zillow, Inc. for informational purposes only. Actual amounts may vary.
HOA fees may include property taxes on listings classified as Co-Ops. Contact the listing agent and/or owner for fee details.
Mortgage interest rates are dependent on a number of factors, including credit score, down payment, and repayment length. Interest rate data provided by Zillow Group Marketplace, Inc. as of 1/1/1970 from various mortgage lenders with which we have lead or other similar arrangements; the Estimated Payment is an average of those rates.
See how much you could borrow to make a competitive offer.
Climate risks
Neighborhood: 92868
Nearby schools
GreatSchools rating
- 5/10West Orange Elementary SchoolGrades: K-6Distance: 0.4 mi
- 5/10Portola Middle SchoolGrades: 7-8Distance: 0.3 mi
- 5/10Orange High SchoolGrades: 9-12Distance: 1.6 mi


- California
- Orange County
- Orange
- 92868
- 1813 W Robin Rd
Nearby cities
Nearby zip codes
Other Orange Topics
