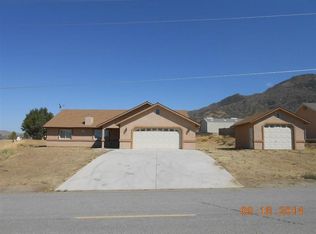
This 2028 square foot single family home has 3 bedrooms and 2.0 bathrooms. This home is located at 18140 Bowie St, Tehachapi, CA 93561.
Pre-foreclosure
Street View
Est. $462,200
18140 Bowie St, Tehachapi, CA 93561
3beds
2baths
2,028sqft
SingleFamily
Built in 2006
0.37 Acres Lot
$462,200 Zestimate®
$228/sqft
$-- HOA
Overview
- 284 days |
- 13 |
- 0 |
Facts & features
Interior
Bedrooms & bathrooms
- Bedrooms: 3
- Bathrooms: 2
Heating
- Forced air
Cooling
- Refrigerator
Features
- Has fireplace: Yes
Interior area
- Total interior livable area: 2,028 sqft
Property
Parking
- Parking features: Garage - Attached
Lot
- Size: 0.37 Acres
Details
- Parcel number: 31811213
Construction
Type & style
- Home type: SingleFamily
Materials
- wood frame
Condition
- Year built: 2006
Community & HOA
Location
- Region: Tehachapi
Financial & listing details
- Price per square foot: $228/sqft
- Tax assessed value: $434,319
- Annual tax amount: $5,314
Visit our professional directory to find a foreclosure specialist in your area that can help with your home search.
Find a foreclosure agentForeclosure details
Estimated market value
$462,200
$439,000 - $485,000
$2,647/mo
Price history
| Date | Event | Price |
|---|---|---|
| 4/4/2006 | Sold | $289,000+502.1%$143/sqft |
Source: Public Record Report a problem | ||
| 6/27/2005 | Sold | $48,000+140%$24/sqft |
Source: Public Record Report a problem | ||
| 4/30/2004 | Sold | $20,000+566.7%$10/sqft |
Source: Public Record Report a problem | ||
| 4/29/1999 | Sold | $3,000$1/sqft |
Source: Public Record Report a problem | ||
Public tax history
| Year | Property taxes | Tax assessment |
|---|---|---|
| 2025 | $5,314 +0.7% | $434,319 +2% |
| 2024 | $5,276 +3.5% | $425,804 +2% |
| 2023 | $5,096 +6.8% | $417,456 +8.4% |
| 2022 | $4,770 | $385,000 +4.9% |
| 2021 | -- | $367,000 +9.2% |
| 2020 | $4,313 -1.8% | $336,000 |
| 2019 | $4,392 +11.3% | $336,000 +10.2% |
| 2018 | $3,945 -2.9% | $305,000 -1.3% |
| 2017 | $4,063 +22.5% | $309,000 +21.2% |
| 2016 | $3,317 +2.5% | $255,000 +0.8% |
| 2015 | $3,235 +8.8% | $253,000 +10.5% |
| 2014 | $2,973 | $229,000 |
| 2013 | -- | $229,000 +8.6% |
| 2012 | $2,639 -0.1% | $210,850 |
| 2011 | $2,641 -5.1% | $210,850 -5.4% |
| 2010 | $2,784 -0.8% | $223,000 |
| 2009 | $2,806 -29.2% | $223,000 -30.1% |
| 2008 | $3,961 +7.1% | $319,000 +10.4% |
| 2007 | $3,697 +242% | $289,000 +319.1% |
| 2006 | $1,081 +121.3% | $68,960 +238% |
| 2005 | $488 +121.6% | $20,400 +505% |
| 2004 | $220 +0.3% | $3,372 +1.9% |
| 2003 | $220 | $3,310 +4% |
| 2002 | $220 +0.6% | $3,183 +2% |
| 2001 | $218 | $3,121 |
| 2000 | -- | $3,121 |
Find assessor info on the county website
Monthly payment
Estimated monthly payment$1,822
All calculations are estimates and provided by Zillow, Inc. for informational purposes only. Actual amounts may vary.
HOA fees may include property taxes on listings classified as Co-Ops. Contact the listing agent and/or owner for fee details.
Mortgage interest rates are dependent on a number of factors, including credit score, down payment, and repayment length. Interest rate data provided by Zillow Group Marketplace, Inc. as of 1/1/1970 from various mortgage lenders with which we have lead or other similar arrangements; the Estimated Payment is an average of those rates.
See how much you could borrow to make a competitive offer.
Climate risks
Neighborhood: Stallion Springs
Nearby schools
GreatSchools rating
- 8/10Cummings Valley Elementary SchoolGrades: K-5Distance: 4.2 mi
- 2/10Jacobsen Middle SchoolGrades: 6-8Distance: 10.7 mi
- 5/10Tehachapi High SchoolGrades: 9-12Distance: 10.7 mi


- California
- Kern County
- Tehachapi
- 93561
- Stallion Springs
- 18140 Bowie St
Nearby cities
Nearby neighborhoods
Nearby zip codes
Other Tehachapi Topics
