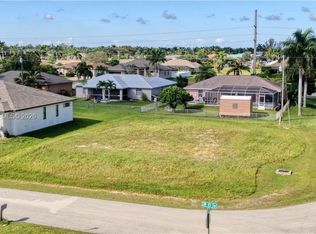
Now is your chance to own one or more lots in highly desirable Southwest Cape Coral. Buy this lot and the one to the left of it and you'll have a big beautiful corner lot to custom build your perfect Florida home. Located just miles to grocery stores, restaurants, and shopping and only 16 miles from Fort Myers Beach, this property puts you in a perfect location. No HOA and all assessments paid make it even more perfect. Although there are burrowing owls on the property, there are steps that can be taken to remove them. Come take a look at this lot and the area. You won't be disappointed. **Lot to the left is also for sale.**
Active
$110,000
1815 SW 43rd St, Cape Coral, FL 33914
--beds
--baths
10,628Square Feet
Unimproved Land
Built in ----
10,628 Square Feet Lot
$-- Zestimate®
$--/sqft
$-- HOA
What's special
Big beautiful corner lot
- 19 hours
- 13
- 1
Zillow last checked:
Listing updated:
Listed by:
Kelby Rendeiro 305-699-2236,
Caretta Blue LLC
Source: Florida Gulf Coast MLS,MLS#: 2026048729 Originating MLS: Florida Gulf Coast
Facts & features
Interior
Video & virtual tour
Property
Features
- Waterfront features: None
Lot
- Size: 10,628 Square Feet
- Dimensions: 84 x 127 x 84 x 127
- Features: Cleared, Other, Rectangular Lot
- Residential vegetation: Grassed
Details
- Parcel number: 094523C204740.0810
- Lease amount: $0
- Zoning description: R1-D
- Special conditions: Build To Suit
Utilities & green energy
- Sewer: Assessment Paid, Public Sewer
- Water: Assessment Paid, Public
- Utilities for property: None
Community & HOA
Community
- Features: Non-Gated, None
- Condo and coop fee: $0
- Membership fee: $0
- Subdivision: CAPE CORAL
HOA
- Amenities included: None
- Services included: None
Location
- Region: Cape Coral
Financial & listing details
- Tax assessed value: $88,825
- Annual tax amount: $1,389
- Date on market: 11/18/2026
- Listing terms: All Financing Considered,Cash,FHA,VA Loan
- Road surface type: Paved
Estimated market value
Not available
Estimated sales range
Not available
Not available
Price history
| Date | Event | Price |
|---|---|---|
| 11/18/2026 | Listed for sale | $110,000+315.1% |
Source:  Florida Gulf Coast MLS #2026048729 Report a problem | ||
| 5/22/1992 | Sold | $26,500 |
Source: Agent Provided Report a problem | ||
Public tax history
| Year | Property taxes | Tax assessment |
|---|---|---|
| 2025 | $1,389 +0.2% | $27,723 +10% |
| 2024 | $1,387 +14.3% | $25,203 +10% |
| 2023 | $1,213 +12.8% | $22,912 +10% |
| 2022 | $1,076 +5% | $20,829 +10% |
| 2021 | $1,025 -17.8% | $18,935 +10% |
| 2020 | $1,246 -9% | $17,214 -53.1% |
| 2019 | $1,369 | $36,700 +4.9% |
| 2018 | $1,369 -1% | $35,000 -0.4% |
| 2017 | $1,383 +1% | $35,126 +21.1% |
| 2016 | $1,369 +2.2% | $29,000 |
| 2015 | $1,340 -4.9% | $29,000 +55.1% |
| 2014 | $1,410 +16.6% | $18,700 +85.1% |
| 2013 | $1,209 +13.1% | $10,100 +21.7% |
| 2012 | $1,069 +2.6% | $8,300 +13.7% |
| 2011 | $1,042 -10.9% | $7,300 -43.8% |
| 2010 | $1,170 +3.6% | $13,000 +23.8% |
| 2009 | $1,130 -13.6% | $10,500 -54.3% |
| 2008 | $1,307 -46.6% | $23,000 -74.1% |
| 2007 | $2,448 -13.6% | $88,830 -7.1% |
| 2006 | $2,835 +63.4% | $95,600 +354.6% |
| 2004 | $1,734 +18.3% | $21,030 +140.3% |
| 2003 | $1,466 +1009.4% | $8,750 +99.8% |
| 2002 | $132 | $4,380 -27.2% |
| 2000 | -- | $6,020 |
Find assessor info on the county website
Monthly payment
Climate risks
Neighborhood: 33914

Similar homes
- $125,0000.26 acres1819 SW 43rd St, Cape Coral, FL 33914Lot/Land

 MLS ID #2026048722, Kelby Rendeiro, Caretta Blue LLC. Florida Gulf Coast MLS
- $94,90010,018 sqft4117 SW 14th Pl, Cape Coral, FL 33914Lot/Land
 MLS ID #2026048146, Brian Barnhart, Gulf Gateway Realty, Inc.. Florida Gulf Coast MLS
- $139,50010,454 sqftCape Coral, Cape Coral, FL 33914Lot/Land
 MLS ID #A11945768, Edward Schiff, Schiff Realty, Inc. MIAMI
- $85,00010,018 sqft634 SW 31st Ter, Cape Coral, FL 33914Lot/Land
 MLS ID #2026047006, Dylan Mercer, Experience Real Estate Group. Florida Gulf Coast MLS
- $110,00010,019 sqft2510 MIRACLE PARKWAY LOT 17, CAPE CORAL, FL 33914Lot/Land
 MLS ID #A4563518, Marilyn Sakelaris, LESLIE WELLS REALTY, INC.. Stellar MLS
- $105,00010,019 sqft805 SW 6TH COURT LOT 65, CAPE CORAL, FL 33991Lot/LandMLS ID #A4687978, Patricia Cain, AXEN REALTY LLC. Stellar MLS
- $95,0000.26 acres1156 Mohawk Pkwy, Cape Coral, FL 33914Lot/LandMLS ID #2026004955, Jeffrey Miloff, The Keyes Company. Florida Gulf Coast MLS
- $119,0000.27 acres118 SW 31st Terrace Cpe, Coral, FL 33914Lot/LandMLS ID #2026043499, Mary Socin-Schmitz, Distinctive Realty and Homes, LLC. Florida Gulf Coast MLS
- $60,00010,018 sqft3602 SW 15th Pl, Cape Coral, FL 33914Lot/LandMLS ID #225025323, Joseph Ponzio, Realty One Group MVP. Florida Gulf Coast MLS
- $95,0000.27 acres134 SW 31st Ter, Cape Coral, FL 33914Lot/LandMLS ID #2026038037, Beate Wunderer, Synergy Realty Inc.. Florida Gulf Coast MLS
- $153,90010,018 sqft3009 SW 11th Pl, Cape Coral, FL 33914Lot/LandMLS ID #2026027144, Leo Gomez, Ace Realty & Associates, LLC. Florida Gulf Coast MLS
- $140,00010,018 sqft2247 SW 27th St, Cape Coral, FL 33914Lot/LandMLS ID #2026004146, Oscar Arroliga, EXP Realty LLC. Florida Gulf Coast MLS
- $70,00010,628 sqft1235 NW 20th Pl, Cape Coral, FL 33993Lot/LandMLS ID #2026048290, Jeff Tumbarello, Steelbridge Realty LLC. Florida Gulf Coast MLS
- $99,00010,018 sqft218 SE 47th St, Cape Coral, FL 33904Lot/LandMLS ID #2026019622, Gerhard Jakobeit, RE/MAX Realty Group. Florida Gulf Coast MLS
- $95,0000.37 acres3928 SE 4th Ave, Cape Coral, FL 33904Lot/LandMLS ID #2026026672, Markus Hartwich, Gulf Gateway Realty, Inc.. Florida Gulf Coast MLS
- $68,00010,018 sqftCape Coral, Cape Coral, FL 33993Lot/LandMLS ID #A12123547, Kevin Page, CapeCoralLots.com. MIAMI
- $79,90010,018 sqft130 SE 23rd Pl, Cape Coral, FL 33990Lot/LandMLS ID #2026046635, Markus Hartwich, Gulf Gateway Realty, Inc.. Florida Gulf Coast MLS
- $126,0000.35 acres806 Skyline Blvd, Cape Coral, FL 33991Lot/LandMLS ID #2026035370, Dayana Nogueiras, Asuan Realty LLC. Florida Gulf Coast MLS
- $64,90010,018 sqft1910 NW 24th Pl, Cape Coral, FL 33993Lot/LandMLS ID #2026047173, Kevin Heikes, Coldwell Banker Realty. Florida Gulf Coast MLS
- $90,00010,019 sqft312 SE 19TH LANE LOT 7, CAPE CORAL, FL 33990Lot/LandMLS ID #A4563598, Marilyn Sakelaris, LESLIE WELLS REALTY, INC.. Stellar MLS
