$26,580
4 bd|1 ba|1.7k sqft
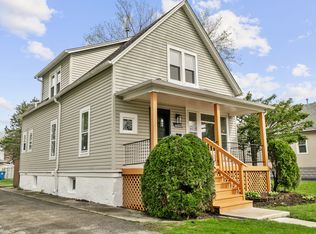
18353 Morris Ave, Homewood, IL 60430
Off Market
Zillow last checked:
Randi Quigley (708)446-0328,
eXp Realty,
Jessica Koce-Diaz 708-359-0566,
eXp Realty
Not available
Estimated sales range
Not available
Not available
| Date | Event | Price |
|---|---|---|
| 5/23/2026 | Contingent | $384,900$175/sqft |
Source: eXp Realty #12639634 Report a problem | ||
| 5/13/2026 | Listed for sale | $384,900+5.5%$175/sqft |
Source: eXp Realty #12639634 Report a problem | ||
| 1/23/2024 | Sold | $365,000+261.4%$166/sqft |
Source: Public Record Report a problem | ||
| 3/27/2019 | Sold | $101,000+0.3%$46/sqft |
Source: Public Record Report a problem | ||
| 2/11/2019 | Price change | $100,660-7.4%$46/sqft |
Source: Auction.com Report a problem | ||
| 5/3/2018 | Listed for sale | -- |
Source: Auction.com Report a problem | ||
| 3/8/2018 | Listing removed | $108,689+11.1%$49/sqft |
Source: Auction.com Report a problem | ||
| 2/8/2018 | Listed for sale | $97,822-0.1%$44/sqft |
Source: Auction.com Report a problem | ||
| 7/18/2017 | Listing removed | $97,949-36.8%$45/sqft |
Source: Auction.com Report a problem | ||
| 5/5/2017 | Listed for sale | -- |
Source: Auction.com Report a problem | ||
| 5/5/2015 | Sold | $155,000-8.6%$70/sqft |
Source: | ||
| 3/28/2015 | Pending sale | $169,500$77/sqft |
Source: Baird & Warner Real Estate #08819590 Report a problem | ||
| 3/5/2015 | Price change | $169,500-5.3%$77/sqft |
Source: Baird & Warner Real Estate #08819590 Report a problem | ||
| 1/20/2015 | Listing removed | $1,850$1/sqft |
Source: Owner Report a problem | ||
| 1/20/2015 | Listed for sale | $179,000+145.2%$81/sqft |
Source: Baird & Warner Real Estate #08819590 Report a problem | ||
| 12/31/2014 | Listed for rent | $1,850$1/sqft |
Source: Owner Report a problem | ||
| 5/27/2014 | Sold | $73,000-0.7%$33/sqft |
Source: | ||
| 5/9/2014 | Pending sale | $73,500$33/sqft |
Source: RE/MAX Synergy #08497482 Report a problem | ||
| 3/19/2014 | Price change | $73,500-8%$33/sqft |
Source: RE/MAX Synergy #08497482 Report a problem | ||
| 1/7/2014 | Price change | $79,900-5.9%$36/sqft |
Source: RE/MAX Synergy #08497482 Report a problem | ||
| 12/4/2013 | Listed for sale | $84,900-57.6%$39/sqft |
Source: RE/MAX Synergy #08497482 Report a problem | ||
| 1/11/2007 | Sold | $200,000$91/sqft |
Source: Public Record Report a problem | ||
| Year | Property taxes | Tax assessment |
|---|---|---|
| 2024 | -- | $18,000 |
| 2023 | $7,439 +50.2% | $18,000 +88% |
| 2022 | $4,953 +7.2% | $9,574 |
| 2021 | $4,619 +2.9% | $9,574 |
| 2020 | $4,487 +76.9% | $9,574 +83.3% |
| 2019 | $2,536 -60.8% | $5,222 -62.1% |
| 2018 | $6,471 -0.3% | $13,773 |
| 2017 | $6,488 +30.2% | $13,773 +33.2% |
| 2016 | $4,985 +0.7% | $10,338 |
| 2015 | $4,949 +1.9% | $10,338 |
| 2014 | $4,856 -8% | $10,338 -15.3% |
| 2013 | $5,276 +2% | $12,207 |
| 2012 | $5,171 +7.1% | $12,207 |
| 2011 | $4,828 -5.1% | $12,207 -17.1% |
| 2010 | $5,088 -1.8% | $14,717 |
| 2009 | $5,180 +6.2% | $14,717 -5% |
| 2008 | $4,878 +11.8% | $15,491 +12.9% |
| 2007 | $4,364 +1.2% | $13,725 |
| 2006 | $4,310 -1.2% | $13,725 |
| 2005 | $4,361 +13.8% | $13,725 +14.7% |
| 2004 | $3,831 +602% | $11,961 +598.7% |
| 2003 | $546 +30.2% | $1,712 +23.2% |
| 2001 | $419 -82.4% | $1,390 -85.8% |
| 2000 | $2,378 +6.2% | $9,761 |
| 1999 | $2,240 | $9,761 |
Find assessor info on the county website
Source: MRED as distributed by MLS GRID. This data may not be complete. We recommend contacting the local school district to confirm school assignments for this home.
A local agent can set up tours, give advice and negotiate with sellers.
A local lender can help you make sure your offer is ready when you are.