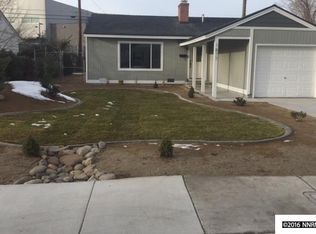
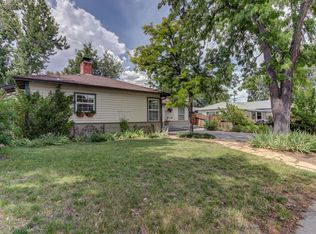
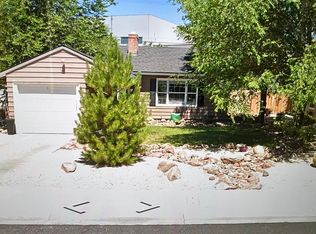
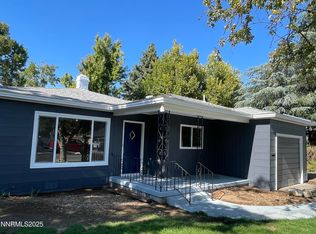
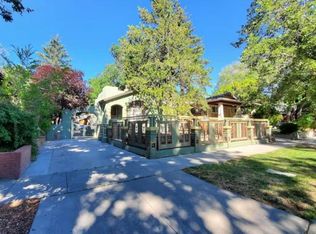
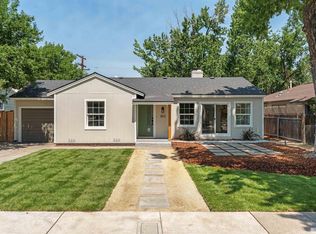
$599,900
3 bd|1 ba|1k sqft
1813 Westfield Ave, Reno, NV 89509
Sold
Likely to sell faster than
Zillow last checked:
Listing updated:
Gregg Moore S.175610 775-338-0073,
Chase International-Damonte
$521,800
$496,000 - $548,000
$2,734/mo
| Date | Event | Price |
|---|---|---|
| 6/12/2026 | Contingent | $539,000$370/sqft |
Source: | ||
| 6/11/2026 | Listed for sale | $539,000$370/sqft |
Source: | ||
| 11/2/2017 | Listing removed | $1,700$1/sqft |
Source: Shoenberger & Shoenberger Inc. Report a problem | ||
| 10/21/2017 | Listed for rent | $1,700$1/sqft |
Source: Shoenberger & Shoenberger Inc. Report a problem | ||
| Year | Property taxes | Tax assessment |
|---|---|---|
| 2026 | $1,048 +2.9% | $65,162 +9.5% |
| 2025 | $1,018 +2.9% | $59,497 +1.7% |
| 2024 | $990 +3% | $58,521 -0.8% |
| 2023 | $961 +2.9% | $58,982 +18.4% |
| 2022 | $934 +3.2% | $49,828 +27.8% |
| 2021 | $905 +5% | $38,992 +11.8% |
| 2020 | $862 -4.7% | $34,892 |
| 2019 | $905 +5% | $34,892 +23.3% |
| 2018 | $862 +12% | $28,288 -0.7% |
| 2017 | $770 | $28,498 +8.1% |
| 2016 | $770 | $26,370 +10.1% |
| 2015 | $770 +0.2% | $23,958 +12% |
| 2014 | $768 +3.1% | $21,400 +8.8% |
| 2013 | $746 | $19,675 |
| 2012 | -- | $19,675 +1.1% |
| 2011 | -- | $19,468 -15.7% |
| 2010 | -- | $23,101 -18.9% |
| 2009 | -- | $28,491 -9.7% |
| 2008 | -- | $31,552 -18.9% |
| 2007 | -- | $38,919 +18.7% |
| 2006 | -- | $32,774 +6.7% |
| 2005 | -- | $30,706 +33.6% |
| 2004 | -- | $22,983 -0.6% |
| 2003 | -- | $23,124 +0.4% |
| 2002 | -- | $23,037 |
| 2001 | -- | $23,037 |
Find assessor info on the county website
Source: NNRMLS. This data may not be complete. We recommend contacting the local school district to confirm school assignments for this home.
A local agent can set up tours, give advice and negotiate with sellers.