$241,800
-- bd|-- ba|1.3k sqft
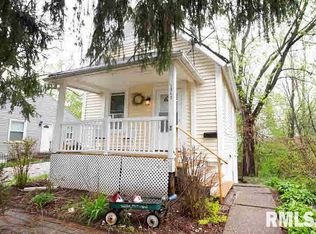
1844 31st St #A, Moline, IL 61265
Off Market
Likely to sell faster than
Zillow last checked:
Paul-Richard Pierre (563)499-4903,
Real Broker, LLC
Not available
Estimated sales range
Not available
Not available
| Date | Event | Price |
|---|---|---|
| 4/11/2024 | Listing removed | -- |
Source: Zillow Rentals Report a problem | ||
| 3/26/2024 | Listed for rent | $1,325$1/sqft |
Source: Zillow Rentals Report a problem | ||
| 2/19/2021 | Listing removed | -- |
Source: Owner Report a problem | ||
| 3/7/2016 | Listing removed | $90,000$75/sqft |
Source: Owner Report a problem | ||
| 1/6/2016 | Listed for sale | $90,000+41.3%$75/sqft |
Source: Owner Report a problem | ||
| 12/17/2013 | Sold | $63,700-28.4%$53/sqft |
Source: | ||
| 3/14/2012 | Listing removed | $89,000$74/sqft |
Source: Mel Foster Co. Inc of Iowa #4130464 Report a problem | ||
| 11/12/2011 | Listed for sale | $89,000-19%$74/sqft |
Source: Mel Foster Co. Inc of Iowa #4130464 Report a problem | ||
| 7/8/2011 | Listing removed | $109,900$92/sqft |
Source: QCA Progressive Partners, LLC. #4122396 Report a problem | ||
| 4/10/2011 | Price change | $109,900-6.5%$92/sqft |
Source: QCA Progressive Partners, LLC. #4122396 Report a problem | ||
| 1/16/2011 | Listed for sale | $117,500+19.9%$98/sqft |
Source: QCA Progressive Partners, LLC. #4122396 Report a problem | ||
| 4/23/2009 | Sold | $98,000+5.9%$82/sqft |
Source: Public Record Report a problem | ||
| 8/18/2006 | Sold | $92,500$77/sqft |
Source: Public Record Report a problem | ||
| Year | Property taxes | Tax assessment |
|---|---|---|
| 2024 | $4,382 +6.6% | $50,242 +8.6% |
| 2023 | $4,110 +14.6% | $46,264 +15.8% |
| 2022 | $3,586 +0.4% | $39,952 +4.6% |
| 2021 | $3,573 +0.5% | $38,195 +1.7% |
| 2020 | $3,555 +0.9% | $37,556 +1.6% |
| 2019 | $3,524 +2.7% | $36,965 +1.5% |
| 2018 | $3,433 +1.7% | $36,409 +1.6% |
| 2017 | $3,375 +2.6% | $35,836 +3.2% |
| 2016 | $3,290 +2.3% | $34,725 +2.3% |
| 2015 | $3,215 +310.4% | $33,937 -1% |
| 2014 | $783 | $34,276 |
| 2013 | $783 | $34,276 -1.8% |
| 2012 | -- | $34,915 -2% |
| 2011 | -- | $35,627 |
| 2010 | -- | $35,627 +1% |
| 2008 | -- | $35,274 +5.1% |
| 2006 | -- | $33,575 +5.6% |
| 2005 | $2,316 -12.3% | $31,802 +3% |
| 2004 | $2,639 +2.4% | $30,876 +3% |
| 2003 | $2,578 +4.3% | $29,977 +4% |
| 2002 | $2,471 +2.9% | $28,824 +3.5% |
| 2001 | $2,402 +6.1% | $27,849 +5% |
| 2000 | $2,263 | $26,523 |
Find assessor info on the county website
Source: MRED as distributed by MLS GRID. This data may not be complete. We recommend contacting the local school district to confirm school assignments for this home.
A local agent can set up tours, give advice and negotiate with sellers.
A local lender can help you make sure your offer is ready when you are.