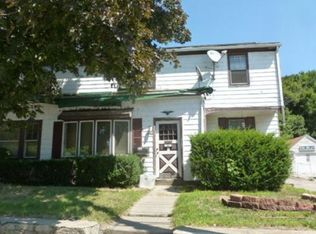
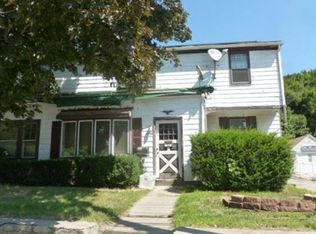
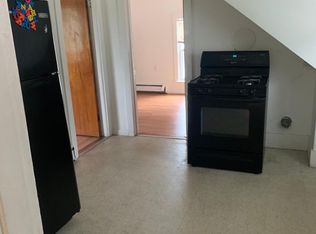
Great investment opportunity with a 1-family & 2-family PROPERTIES on 1.29 acres of land (zoned R2) in Woonsocket on the Cumberland line! Property would fit a Multi-Family lot, but gives a single-family house (owner occ) with a two-family income-producing mortgage helper, or have both houses for an investment with plenty of upside for additional buildings such as an ADU or an additional SF house. Serious buyers only.**DO NOT ATTEMPT TO GO ON THE PROPERTY WITHOUT A CONFIRMED APPOINTMENT. ** YOU MUST HAVE POF’S, CASH, OR HM FOR THIS DEAL!! ** POSSIBLE FHA 203K FINANCING
Active
Price cut: $15K (11/2)
$435,000
1888 Mendon Rd, Woonsocket, RI 02895
7beds
3,400sqft
Multi Family
Built in 1910
-- sqft lot
$430,100 Zestimate®
$128/sqft
$-- HOA
What's special
- 45 days
- 792
- 48
Zillow last checked:
Listing updated:
Listed by:
Michael Ouellette,
Real Results Realty
Source: StateWide MLS RI,MLS#: 1424603
Facts & features
Interior
Bedrooms & bathrooms
- Bedrooms: 7
- Bathrooms: 4
- Full bathrooms: 3
- 1/2 bathrooms: 1
Heating
- Natural Gas, Baseboard
Cooling
- None
Appliances
- Included: Gas Water Heater
Features
- Flooring: Hardwood, Laminate, Wood
- Basement: Full,Bulkhead,Unfinished
- Has fireplace: No
Interior area
- Total structure area: 3,500
- Total interior livable area: 3,400 sqft
Property
Parking
- Total spaces: 10
- Parking features: Attached
- Attached garage spaces: 4
Lot
- Size: 1.29 Acres
Details
- Parcel number: WOONM50BL7U28
- Zoning: R2
Construction
Type & style
- Home type: MultiFamily
- Property subtype: Multi Family
- Attached to another structure: Yes
Materials
- Vinyl Siding
- Foundation: Brick/Mortar, Block, Concrete Perimeter
Condition
- New construction: No
- Year built: 1910
Utilities & green energy
- Electric: 100 Amp Service
- Sewer: Public Sewer
- Water: Municipal
Community & HOA
HOA
- Has HOA: No
Location
- Region: Woonsocket
Financial & listing details
- Price per square foot: $128/sqft
- Tax assessed value: $528,700
- Annual tax amount: $8,538
- Date on market: 9/29/2026
- Inclusions: Properties being SOLD AS IS WHERE IS, Buyer and agents to perform all due diligence. Seller has not lived in the property. Seller is related to the Listing Broker.
- Total actual rent: 0
- Tenant pays: Heat
Estimated market value
$430,100
$409,000 - $452,000
$2,205/mo
Price history
| Date | Event | Price |
|---|---|---|
| 11/2/2026 | Price change | $435,000-3.3%$128/sqft |
Source:  StateWide MLS RI #1424603 Report a problem | ||
| 10/5/2026 | Price change | $450,000+15.4%$132/sqft |
Source: StateWide MLS RI #1424603 Report a problem | ||
| 10/3/2026 | Listed for sale | $390,000+2.6%$115/sqft |
Source: StateWide MLS RI #1424603 Report a problem | ||
| 8/31/2026 | Sold | $380,000$112/sqft |
Source: Public Record Report a problem | ||
Public tax history
| Year | Property taxes | Tax assessment |
|---|---|---|
| 2025 | $7,687 | $528,700 |
| 2024 | $7,687 +4% | $528,700 |
| 2023 | $7,391 | $528,700 |
| 2022 | $7,391 +19.5% | $528,700 +103% |
| 2021 | $6,185 +5.3% | $260,400 |
| 2020 | $5,875 -1.4% | $260,400 |
| 2018 | $5,957 -20.5% | $260,400 +4.6% |
| 2017 | $7,495 -5.5% | $249,000 |
| 2016 | $7,928 -13% | $249,000 |
| 2015 | $9,108 +10.1% | $249,000 +5% |
| 2014 | $8,269 +0.9% | $237,200 |
| 2013 | $8,198 +7.1% | $237,200 +900% |
| 2012 | $7,652 -0.8% | $23,720 -92.3% |
| 2011 | $7,711 +6.2% | $307,200 |
| 2010 | $7,259 -1.8% | $307,200 -7.1% |
| 2009 | $7,394 +84.4% | $330,700 +9.1% |
| 2008 | $4,009 +6.7% | $303,000 |
| 2006 | $3,757 +0.8% | $303,000 +93.9% |
| 2004 | $3,728 | $156,300 |
Find assessor info on the county website
Monthly payment
Est. payment