Check out this amazing Tri-level home in Primrose Estates! Meticulously cared for and maintained, you are sure to be impressed. This home boasts over an acre lot, not just one but TWO garages, and so many updates! So much to love, don't miss out!
Pending
$289,990
19 Hollyhock, Riverton, IL 62561
3beds
2,016sqft
Single Family Residence, Residential
Built in ----
1.17 Acres Lot
$284,300 Zestimate®
$144/sqft
$-- HOA
What's special
- 4 days
- 31
- 0
Zillow last checked:
Listing updated:
Listed by:
Dane Cookson Pref:217-971-8101,
The Real Estate Group, Inc.
Source: RMLS Alliance as distributed by MLS GRID,MLS#: CA1047162 Originating MLS: Capital Area Association of Realtors
Facts & features
Interior
Bedrooms & bathrooms
- Bedrooms: 3
- Bathrooms: 2
- Full bathrooms: 2
Bedroom 1
- Level: Upper
- Dimensions: 13ft 6in x 11ft 7in
Bedroom 2
- Level: Upper
- Dimensions: 12ft 0in x 11ft 0in
Bedroom 3
- Level: Upper
- Dimensions: 9ft 5in x 9ft 4in
Kitchen
- Level: Main
- Dimensions: 12ft 3in x 11ft 7in
Lower level
- Area: 660
Main level
- Area: 696
Upper level
- Area: 660
Heating
- Forced Air, Heat Pump
Cooling
- Central Air, Heat Pump
Features
- Has basement: Yes
- Number of fireplaces: 1
Interior area
- Total structure area: 2,016
- Total interior livable area: 2,016 sqft
Property
Parking
- Total spaces: 2
- Parking features: Attached, Detached
- Attached garage spaces: 2
Lot
- Size: 1.17 Acres
- Dimensions: 1.17 Acres
- Features: Level
Details
- Parcel number: 1504.0177003
Construction
Type & style
- Home type: SingleFamily
- Property subtype: Single Family Residence, Residential
Materials
- Vinyl Siding
- Roof: Shingle
Condition
- New construction: No
Utilities & green energy
- Sewer: Septic Tank
- Water: Private
Community & HOA
Community
- Subdivision: Primrose Estates
Location
- Region: Riverton
Financial & listing details
- Price per square foot: $144/sqft
- Tax assessed value: $245,247
- Annual tax amount: $4,851
- Date on market: 10/15/2026
Estimated market value
$284,300
$267,000 - $301,000
$2,127/mo
Price history
| Date | Event | Price |
|---|---|---|
| 10/15/2026 | Pending sale | $289,990+48.7%$144/sqft |
Source:  RMLS Alliance as distributed by MLS GRID #CA1047162 Report a problem | ||
| 10/29/2020 | Sold | $195,000-2.5%$97/sqft |
Source: RMLS Alliance as distributed by MLS GRID #CA1002642 Report a problem | ||
| 9/24/2020 | Pending sale | $200,000$99/sqft |
Source: RE/MAX Professionals #CA1002642 Report a problem | ||
| 9/21/2020 | Price change | $200,000-2.4%$99/sqft |
Source: RE/MAX Professionals #CA1002642 Report a problem | ||
| 9/13/2020 | Listed for sale | $205,000+26.5%$102/sqft |
Source: Owner Report a problem | ||
| 6/10/2003 | Sold | $162,000$80/sqft |
Source: Public Record Report a problem | ||
Public tax history
| Year | Property taxes | Tax assessment |
|---|---|---|
| 2025 | $4,851 +0.1% | $81,749 +6.5% |
| 2024 | $4,846 +7.5% | $76,767 +8.1% |
| 2023 | $4,508 +0.3% | $71,008 +7.4% |
| 2022 | $4,495 -6.1% | $66,091 -4.6% |
| 2021 | $4,785 +12.1% | $69,267 +0.6% |
| 2020 | $4,268 +7% | $68,820 +0.4% |
| 2019 | $3,989 | $68,512 +1.9% |
| 2018 | $3,989 +2.6% | $67,241 +2.8% |
| 2017 | $3,889 +2.6% | $65,390 +3.2% |
| 2016 | $3,789 +2.1% | $63,381 +2.8% |
| 2015 | $3,713 -5.1% | $61,625 +1.6% |
| 2014 | $3,914 +0.3% | $60,661 -7.7% |
| 2013 | $3,903 +2.7% | $65,699 |
| 2012 | $3,801 +3.9% | $65,699 +1.1% |
| 2011 | $3,658 +1.6% | $64,971 +0.8% |
| 2010 | $3,600 +2% | $64,457 +0.5% |
| 2009 | $3,528 +2.2% | $64,162 +1.7% |
| 2008 | $3,453 +35.9% | $63,113 +34% |
| 2007 | $2,540 +1.2% | $47,085 +4.7% |
| 2006 | $2,510 | $44,972 |
Find assessor info on the county website
Monthly payment
Est. payment
Payment breakdown
Explore the cost of this home by adjusting the details. Changes won't be saved.Climate risks
Neighborhood: 62561
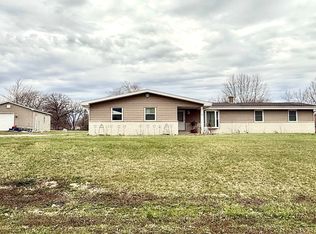
Similar homes
- $299,9005 bd3 ba2.8k sqft32 Birch Lake Dr, Sherman, IL 62684For Sale
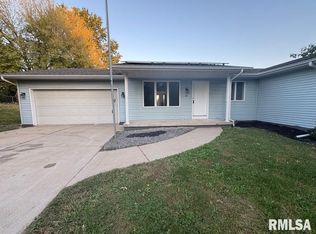
 MLS ID #CA1047185, Khaled Hussein, Keller Williams Capital. RMLS Alliance as distributed by MLS GRID
- $299,9003 bd2 ba2k sqft3326 Brickler Rd, Springfield, IL 62707For Sale
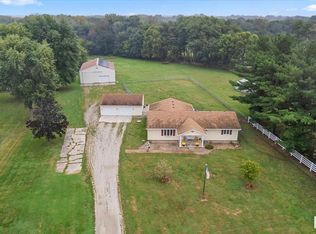 MLS ID #CA1046686, Nicholas Campo, Campo Realty, Inc.. RMLS Alliance as distributed by MLS GRID
- $310,0003 bd2 ba1.9k sqft770 Timber Edge Dr, Sherman, IL 62684For Sale
 MLS ID #CA1047148, Kelly Stotlar, The Real Estate Group, Inc.. RMLS Alliance as distributed by MLS GRID
- $225,0005 bd4 ba2.6k sqft513 N 3rd St, Riverton, IL 62561For Sale
 MLS ID #CA1046266, Gary VanHise, Coldwell Banker Cornerstone. RMLS Alliance as distributed by MLS GRID
- $264,9003 bd3 ba1.7k sqft240 Trillium Ln, Springfield, IL 62707For SaleMLS ID #CA1046846, Jessica Shaffer, Land & Home Real Estate. RMLS Alliance as distributed by MLS GRID
- $259,9003 bd2 ba1.3k sqft2 Knollwood Dr, Sherman, IL 62684For SaleMLS ID #CA1045973, Ronald K Knollenberg, Knollenberg Real Estate. RMLS Alliance as distributed by MLS GRID
- $300,0003 bd2 ba1.7k sqft260 Blue Springs Dr, Sherman, IL 62684For SaleMLS ID #CA1045424, Tracy M Shaw, Keller Williams Capital. RMLS Alliance as distributed by MLS GRID
- $249,0005 bd3 ba2.7k sqft2620 Piper Ln, Springfield, IL 62707For SaleMLS ID #CA1046539, Barbara D Endzelis, RE/MAX Professionals. RMLS Alliance as distributed by MLS GRID
- $349,0003 bd2 ba1.8k sqft1828 S Noble Ave, Springfield, IL 62704For SaleMLS ID #CA1047151, Jane Hay, The Real Estate Group, Inc.. RMLS Alliance as distributed by MLS GRID
- $254,0003 bd2 ba1.4k sqft425 Pakey Rd, Springfield, IL 62712For SaleMLS ID #CA1046979, Debra Sarsany, The Real Estate Group, Inc.. RMLS Alliance as distributed by MLS GRID
- $349,9004 bd4 ba2.8k sqft41 Wind Cave Dr, Springfield, IL 62712For SaleMLS ID #CA1047075, Andrew Kinney, The Real Estate Group, Inc.. RMLS Alliance as distributed by MLS GRID
- $369,9005 bd4 ba2.9k sqft1 Harlan Ct, Springfield, IL 62712For SaleMLS ID #CA1047181, Diane Tinsley, The Real Estate Group, Inc.. RMLS Alliance as distributed by MLS GRID
- $175,0003 bd2 ba1.3k sqft2217 E Sangamon Ave, Springfield, IL 62702For SaleMLS ID #CA1047189, Zack Greenwald, The Real Estate Group, Inc.. RMLS Alliance as distributed by MLS GRID
- $235,0003 bd2 ba1.5k sqft26 Woods Mill Rd, Sherman, IL 62684For SaleMLS ID #CA1045788, John E Kerstein, Keller Williams Capital. RMLS Alliance as distributed by MLS GRID
- $255,0003 bd2 ba2.2k sqft2 Royal Dr, Sherman, IL 62684For SaleMLS ID #CA1046628, Jim Fulgenzi, RE/MAX Professionals. RMLS Alliance as distributed by MLS GRID
- $288,9003 bd2 ba2.1k sqft2921 Arlington Dr, Springfield, IL 62704For SaleMLS ID #CA1046858, Jennifer Coady, RE/MAX Professionals. RMLS Alliance as distributed by MLS GRID
- $309,9003 bd3 ba2.4k sqft118 White Pine Dr, Springfield, IL 62712For SaleMLS ID #CA1047035, Betty Shuster, RE/MAX Professionals. RMLS Alliance as distributed by MLS GRID
- $224,9003 bd2 ba2k sqft2124 Blackhawk Rd, Springfield, IL 62702For SaleMLS ID #CA1046872, Kyle T Killebrew, The Real Estate Group, Inc.. RMLS Alliance as distributed by MLS GRID
