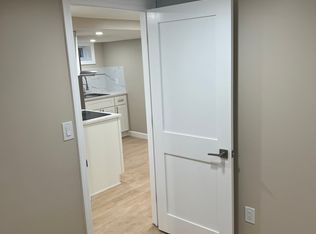
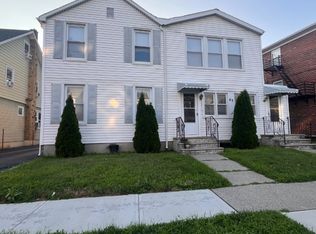
Fantastic Two-Family Home !!! Great Investment Opportunity!Discover this spacious two-family home, offering 3 bedrooms and 1 full bathroom on each floor, plus a finished basement with an additional full bathroom. Each unit features separate utilities, providing added convenience and flexibility for homeowners and investors alike.
Active
$755,000
191 Hillside Ter, Irvington Twp., NJ 07111
6beds
2sqft
Multi Family
Built in 2023
-- sqft lot
$765,400 Zestimate®
$377,500/sqft
$-- HOA
What's special
- 16 days
- 352
- 18
Zillow last checked:
Listing updated:
Listed by:
Gladys Gabriel 973-885-4225,
Weichert Realtors
Source: GSMLS,MLS#: 4063193
Facts & features
Interior
Bedrooms & bathrooms
- Bedrooms: 6
- Bathrooms: 3
- Full bathrooms: 3
Heating
- Forced Air, Natural Gas
Cooling
- See Remarks
Features
- Bedrooms, Eat-in Kitchen, Living/Dining Room, See Remarks, Eat-In Kitchen
- Basement: Yes,Finished
- Has fireplace: No
Interior area
- Total structure area: 2
- Total interior livable area: 2 sqft
Property
Parking
- Total spaces: 4
- Parking features: 2 Car Width, Detached Garage
- Garage spaces: 2
- Uncovered spaces: 4
Features
- Levels: 3-Three Story
- Stories: 3
Lot
- Size: 6,969 Square Feet
- Dimensions: 50 x 136
Details
- Parcel number: 1609000160000000860000
Construction
Type & style
- Home type: MultiFamily
- Property subtype: Multi Family
Materials
- Aluminum Siding
- Roof: Asphalt Shingle
Condition
- Year built: 2023
- Major remodel year: 2023
Utilities & green energy
- Gas: Gas-Natural
- Sewer: See Remarks
- Water: Public
- Utilities for property: Natural Gas Connected
Community & HOA
Location
- Region: Irvington
Financial & listing details
- Price per square foot: $377,500/sqft
- Tax assessed value: $510,000
- Annual tax amount: $13,193
- Date on market: 11/5/2026
- Total actual rent: 0
- Tenant pays: Electricity, Gas, Tenant Pays Heat, Tenant Pays Electric, Tenant Pays Gas
Estimated market value
$765,400
$727,000 - $804,000
$3,115/mo
Price history
| Date | Event | Price |
|---|---|---|
| 11/5/2026 | Listed for sale | $755,000+79.8%$377,500/sqft |
Source:  GSMLS #4063193 Report a problem | ||
| 10/10/2022 | Sold | $420,000+31.3%$210,000/sqft |
Source:  NJMLS #21010500 Report a problem | ||
| 9/28/2021 | Listing removed | -- |
Source:  New Jersey Multiple Listing Service, Inc Report a problem | ||
| 3/26/2021 | Listed for sale | $320,000+86.6%$160,000/sqft |
Source: New Jersey Multiple Listing Service, Inc #21010500 Report a problem | ||
| 3/11/2002 | Sold | $171,500$85,750/sqft |
Source: Public Record Report a problem | ||
Public tax history
| Year | Property taxes | Tax assessment |
|---|---|---|
| 2026 | $13,194 | $510,000 |
| 2025 | $13,194 +23.4% | $510,000 +195.7% |
| 2024 | $10,690 +3.6% | $172,500 |
| 2023 | $10,314 | $172,500 |
| 2022 | $10,314 +0.1% | $172,500 |
| 2021 | $10,309 +2.8% | $172,500 |
| 2020 | $10,029 +2% | $172,500 |
| 2019 | $9,834 | $172,500 |
| 2018 | $9,834 +2.7% | $172,500 |
| 2017 | $9,577 +2.4% | $172,500 |
| 2016 | $9,355 -0.6% | $172,500 |
| 2015 | $9,412 -17% | $172,500 |
| 2014 | $11,344 +3.3% | $172,500 -46.6% |
| 2013 | $10,986 +2.7% | $323,200 |
| 2012 | $10,698 +0.8% | $323,200 |
| 2011 | $10,614 +29.6% | $323,200 |
| 2010 | $8,190 -0.6% | $323,200 |
| 2009 | $8,238 +12.3% | $323,200 |
| 2008 | $7,337 -11.6% | $323,200 |
| 2007 | $8,300 | $323,200 +873.5% |
| 2006 | -- | $33,200 -10.8% |
| 2005 | -- | $37,200 |
| 2004 | -- | $37,200 |
| 2003 | -- | $37,200 |
| 2002 | -- | $37,200 |
| 2001 | -- | $37,200 |
Find assessor info on the county website
Monthly payment
Est. payment