$225,700
3 bd|1 ba|1.1k sqft
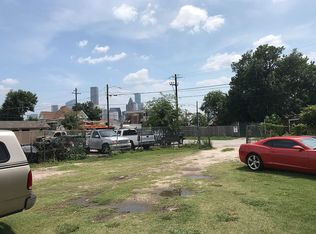
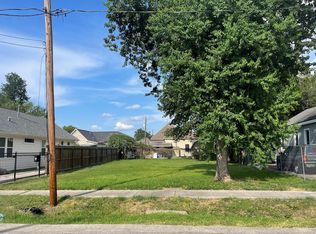
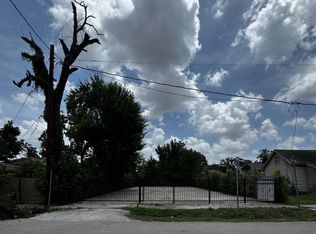
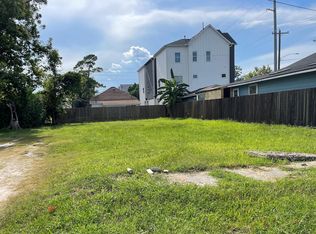
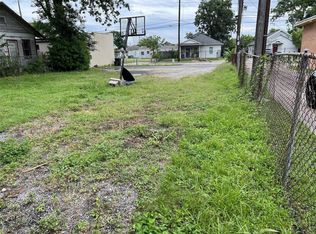
1909 Chestnut St, Houston, TX 77009
Off Market
Zillow last checked:
Listing updated:
Janet Schmidt TREC #0238237 713-419-7918,
Berkshire Hathaway HomeServices Premier Properties
Not available
Estimated sales range
Not available
$1,614/mo
| Date | Event | Price |
|---|---|---|
| 6/24/2026 | Price change | $155,000-6.1% |
Source: | ||
| 4/18/2026 | Price change | $165,000+3.8% |
Source: | ||
| 7/16/2025 | Price change | $159,000-9.1% |
Source: | ||
| 7/1/2025 | Price change | $175,000-16.3% |
Source: | ||
| 4/15/2025 | Listed for sale | $209,000-16.4% |
Source: | ||
| 4/15/2022 | Listing removed | -- |
Source: Owner Report a problem | ||
| 1/30/2022 | Listed for sale | $250,000 |
Source: Owner Report a problem | ||
| 11/1/2021 | Listing removed | -- |
Source: Owner Report a problem | ||
| 8/3/2021 | Listed for sale | $250,000+11.1% |
Source: Owner Report a problem | ||
| 6/8/2021 | Listing removed | -- |
Source: Owner Report a problem | ||
| 3/10/2021 | Listed for sale | $225,000+7.1% |
Source: Owner Report a problem | ||
| 10/28/2020 | Listing removed | $210,000 |
Source: Owner Report a problem | ||
| 3/27/2020 | Price change | $210,000-15.7% |
Source: Owner Report a problem | ||
| 10/26/2019 | Price change | $249,000-0.4% |
Source: Owner Report a problem | ||
| 7/26/2019 | Listed for sale | $250,000 |
Source: Owner Report a problem | ||
| 11/9/2010 | Sold | -- |
Source: Public Record Report a problem | ||
| Year | Property taxes | Tax assessment |
|---|---|---|
| 2025 | $3,379 -12.8% | $185,250 |
| 2024 | $3,876 -41.3% | $185,250 +13% |
| 2023 | $6,604 +138.3% | $163,875 +30.2% |
| 2022 | $2,772 | $125,875 |
| 2021 | -- | $125,875 |
| 2020 | $3,020 -0.9% | $125,875 |
| 2019 | $3,048 +15.5% | $125,875 +20.5% |
| 2018 | $2,640 | $104,500 |
| 2017 | $2,640 +9.9% | $104,500 +10% |
| 2016 | $2,402 +86.9% | $95,000 +58.3% |
| 2015 | $1,285 | $60,000 +20% |
| 2014 | $1,285 | $50,000 |
| 2013 | -- | $50,000 |
| 2012 | -- | $50,000 |
| 2011 | -- | $50,000 |
| 2010 | -- | $50,000 |
| 2009 | -- | $50,000 |
| 2008 | -- | $50,000 +11.1% |
| 2007 | -- | $45,000 +50% |
| 2006 | -- | $30,000 |
| 2005 | -- | $30,000 +50% |
| 2004 | -- | $20,000 +316.7% |
| 2003 | -- | $4,800 |
| 2002 | -- | $4,800 |
| 2001 | -- | $4,800 -67.3% |
| 2000 | -- | $14,700 |
Find assessor info on the county website
Source: HAR. This data may not be complete. We recommend contacting the local school district to confirm school assignments for this home.
A local agent can set up tours, give advice and negotiate with sellers.