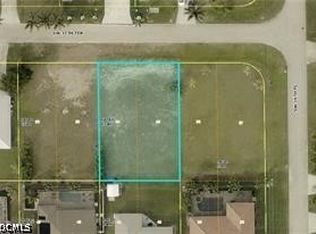
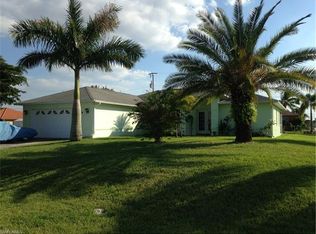
Beautiful Southern Exposure Homesite in Desirable SW Cape Coral
Don’t miss this well-positioned lot featuring sought-after southern rear exposure — ideal for enjoying all-day natural light and warm Florida sunshine from your future outdoor living space.
Located in one of Southwest Cape Coral’s most desirable areas, this homesite offers the perfect setting to design and construct your dream home. City assessments are in and fully paid.
Secure your opportunity to build in a thriving and established neighborhood.
Closed
Zillow last checked:
Listing updated:
Bought with:
Gino De La Torre, 258026903
Magna Realty, LLC
Source: Florida Gulf Coast MLS,MLS#: 2026010434 Originating MLS: Florida Gulf Coast
Originating MLS: Florida Gulf CoastPrice history
| Date | Event | Price |
|---|---|---|
| 10/16/2026 | Sold | $110,000-15.4% |
Source:  Florida Gulf Coast MLS #2026010434 Report a problem Florida Gulf Coast MLS #2026010434 Report a problem | ||
| 9/29/2026 | Pending sale | $130,000 |
Source: Florida Gulf Coast MLS #2026010434 Report a problem | ||
| 8/17/2026 | Price change | $130,000-6.5% |
Source: Florida Gulf Coast MLS #2026010434 Report a problem | ||
| 8/2/2026 | Pending sale | $139,000 |
Source: Florida Gulf Coast MLS #2026010434 Report a problem | ||
| 7/11/2026 | Price change | $139,000-7.3% |
Source: Florida Gulf Coast MLS #2026010434 Report a problem | ||
| 2/28/2026 | Listed for sale | $150,000+50% |
Source: Florida Gulf Coast MLS #2026010434 Report a problem | ||
| 10/26/2023 | Sold | $100,000-16.7% |
Source: Public Record Report a problem | ||
| 6/23/2023 | Listed for sale | $120,000+50% |
Source:  SWFLMLS #223046541 Report a problem SWFLMLS #223046541 Report a problem | ||
| 3/31/2023 | Sold | $80,000 |
Source: Public Record Report a problem | ||