This charming 3-bedroom, 2.5-bath home offers a perfect blend of comfort and functionality. Additional square footage accessed through the garage has separate entrance and access to its own half bath perfect for a home office or 4th bedroom. There is a hanging laundry area in the garage. The extra wide driveway allows for ample parking . The home has a 2 year old covered front porch and a 320 sq ft mite screened porch with a rotating fan in the back being the perfect space for relaxation . The spacious, fully fenced backyard provides plenty of privacy and has a dedicated, 3 year old heated & cooled 240 sq ft shed with hurricane anchors & electric that would be a great workshop for your projects. Home includes a 2025 upgraded electrical system & 5 year old roof. Whether you're entertaining or unwinding, this home is designed for both relaxation and versatility.
For sale
$269,000
193 Evergreen Ln, Middleburg, FL 32068
3beds
1,120sqft
Other
Built in 1980
8,712 Square Feet Lot
$258,200 Zestimate®
$240/sqft
$-- HOA
What's special
- 121 days
- 172
- 3
Zillow last checked:
Listed by:
Jeanne Scholl,
EXIT INSPIRED REAL ESTATE
Source: EXIT Realty broker feed,MLS#: 2154827
Facts & features
Interior
Bedrooms & bathrooms
- Bedrooms: 3
- Bathrooms: 3
- Full bathrooms: 2
- 1/2 bathrooms: 1
Heating
- Other, Electric
Cooling
- Central Air, Other
Features
- Basement:
- Has fireplace: No
Interior area
- Total structure area: 1,120
- Total interior livable area: 1,120 sqft
Video & virtual tour
Property
Lot
- Size: 8,712 Square Feet
Details
- Parcel number: 34042500815320700
Construction
Type & style
- Home type: SingleFamily
- Property subtype: Other
Condition
- Year built: 1980
Community & HOA
Location
- Region: Middleburg
Financial & listing details
- Price per square foot: $240/sqft
- Tax assessed value: $215,238
- Date on market: 7/10/2026
- Lease term: Contact For Details
- Electric utility on property: Yes
Estimated market value
$258,200
$245,000 - $271,000
$1,676/mo
Price history
| Date | Event | Price |
|---|---|---|
| 7/10/2026 | Listed for sale | $269,000-2.2%$240/sqft |
Source:  realMLS #2154827 Report a problem | ||
| 2/1/2026 | Listing removed | $275,000$246/sqft |
Source: EXIT Realty broker feed #2106758 Report a problem | ||
| 10/7/2025 | Price change | $275,000-3.5%$246/sqft |
Source: realMLS #2106758 Report a problem | ||
| 9/2/2025 | Price change | $285,000-2.8%$254/sqft |
Source: realMLS #2106758 Report a problem | ||
| 7/2/2025 | Price change | $293,300-3.3%$262/sqft |
Source: Owner Report a problem | ||
| 6/10/2025 | Price change | $303,300-4.5%$271/sqft |
Source: Owner Report a problem | ||
| 6/1/2025 | Price change | $317,700-1.9%$284/sqft |
Source: Owner Report a problem | ||
| 5/22/2025 | Listed for sale | $323,700+430.7%$289/sqft |
Source: Owner Report a problem | ||
| 8/1/1993 | Sold | $61,000$54/sqft |
Source: Agent Provided Report a problem | ||
Public tax history
| Year | Property taxes | Tax assessment |
|---|---|---|
| 2025 | -- | $215,238 +5.8% |
| 2024 | $3,046 +7.5% | $203,447 +5.7% |
| 2023 | $2,834 +15.5% | $192,529 +14.4% |
| 2022 | $2,454 +12.1% | $168,334 +25.8% |
| 2021 | $2,190 +12.2% | $133,775 +13.1% |
| 2020 | $1,951 | $118,244 +5.1% |
| 2019 | $1,951 +5.6% | $112,553 +16.2% |
| 2018 | $1,848 +18.1% | $96,896 +17.3% |
| 2017 | $1,565 +9.4% | $82,611 +10.7% |
| 2016 | $1,431 +6.6% | $74,647 +4.7% |
| 2015 | $1,342 +0.3% | $71,296 +1.1% |
| 2014 | $1,338 | $70,487 +6.7% |
| 2013 | -- | $66,081 +0% |
| 2012 | -- | $66,074 -2.5% |
| 2011 | -- | $67,755 -11.9% |
| 2010 | -- | $76,909 -21.2% |
| 2009 | -- | $97,652 -6% |
| 2008 | -- | $103,898 -10.8% |
| 2007 | -- | $116,462 +8.6% |
| 2006 | -- | $107,261 +4.6% |
| 2005 | -- | $102,574 +19.9% |
| 2004 | -- | $85,564 +24.6% |
| 2003 | -- | $68,684 +13.8% |
| 2001 | -- | $60,362 +5.3% |
| 2000 | -- | $57,321 |
Find assessor info on the county website
Monthly payment
Est. payment
Payment breakdown
Explore the cost of this home by adjusting the details. Changes won't be saved.Climate risks
Neighborhood: 32068

Similar homes
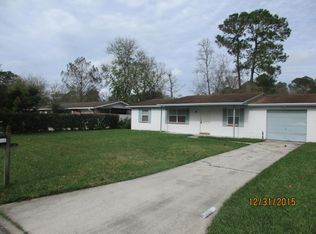
- $229,9004 bd2 ba1.4k sqft1633 MARY BETH Drive, Middleburg, FL 32068For Sale
 MLS ID #2154599, JASON SIMRELL. realMLS
- $245,0003 bd2 ba1.2k sqft333 OLD JENNINGS Road, Orange Park, FL 32065For Sale
 MLS ID #2160296, REBECCA PARKER. realMLS
- $269,0003 bd2 ba1.2k sqft1868 PINETA COVE Drive, Middleburg, FL 32068For Sale
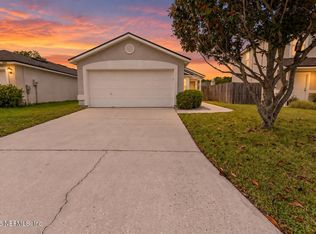 MLS ID #2167477, MORGAN MARIE STOKES. realMLS
- $249,0003 bd2 ba1.3k sqft2762 SHARPES Court, Orange Park, FL 32065For Sale
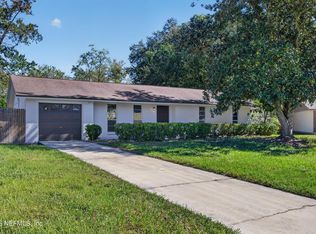 MLS ID #2170235, NARENDRA PATEL. realMLS
