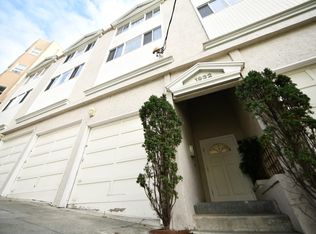
A portfolio for Sale Oakland & El Sobrante Portfolio, a five-property multifamily offering located across three supply-constrained East Bay submarkets. The portfolio offers investors immediate scale in a high-barrier-to-entry market, priced at a significant discount to replacement cost. Oakland: 14 Whitmore Place, 5527 & 5601 Shattuck Avenue, 1932 6th Avenue, 484 37th Street El Sobrante: 4230 San Pablo Dam Road
For sale
$3,415,000
1932 6th Ave, Oakland, CA 94606
20beds
0baths
--sqft
Multi Family
Built in ----
-- sqft lot
$-- Zestimate®
$--/sqft
$-- HOA
What's special
- 115 days
- 63
- 2
Zillow last checked:
Listing updated:
Listed by:
Matthew Killian Flaherty DRE #02075798 415-288-7811,
Colliers International 415-788-3100
Source: SFAR,MLS#: 426147381 Originating MLS: San Francisco Association of REALTORS
Facts & features
Interior
Bedrooms & bathrooms
- Bedrooms: 20
- Bathrooms: 0
Interior area
- Total structure area: 0
Property
Parking
- Total spaces: 10
- Parking features: Covered, Open
- Carport spaces: 6
- Has uncovered spaces: Yes
Features
- Levels: Three Or More
- Stories: 3
Lot
- Size: 9,148 Square Feet
- Features: Curb(s), Other
Details
- Parcel number: 2127411
- Zoning: RM-4, S-13
- Special conditions: Other
Construction
Type & style
- Home type: MultiFamily
- Property subtype: Multi Family
Materials
- Frame, Wood
- Foundation: Concrete
- Roof: Asphalt
Community & HOA
HOA
- Has HOA: No
Location
- Region: Oakland
- Elevation: 0
Financial & listing details
- Tax assessed value: $961,750
- Price range: $3.4M - $3.4M
- Date on market: 7/16/2026
- Cumulative days on market: 75 days
- Total actual rent: 0
Estimated market value
Not available
Estimated sales range
Not available
$2,519/mo
Price history
| Date | Event | Price |
|---|---|---|
| 7/16/2026 | Listed for sale | $3,415,000 |
Source:  SFAR #426147381 Report a problem | ||
Public tax history
| Year | Property taxes | Tax assessment |
|---|---|---|
| 2026 | -- | $961,750 +2% |
| 2025 | $29,131 +6% | $943,132 +2% |
| 2024 | $27,490 -0.8% | $924,879 +1.8% |
| 2023 | $27,720 +8.9% | $908,206 +2% |
| 2022 | $25,444 +16.7% | $890,663 +2% |
| 2021 | $21,807 +1.5% | $873,463 +1% |
| 2020 | $21,492 +13% | $864,645 +2% |
| 2019 | $19,027 +11.4% | $847,955 +2% |
| 2018 | $17,086 | $831,593 +2.1% |
| 2017 | $17,086 +2.6% | $814,233 +2% |
| 2016 | $16,648 -2.1% | $798,509 +1.5% |
| 2015 | $17,008 | $786,701 +2% |
| 2014 | $17,008 | $771,530 +0.4% |
| 2013 | -- | $768,099 +2% |
| 2012 | -- | $753,278 +2% |
| 2011 | -- | $738,746 +0.7% |
| 2010 | -- | $733,317 -0.2% |
| 2009 | -- | $735,036 +2% |
| 2008 | -- | $720,864 +2% |
| 2007 | -- | $706,972 +2% |
| 2006 | -- | $693,348 +2.1% |
| 2005 | -- | $678,893 +2% |
| 2004 | -- | $665,807 +1.8% |
| 2003 | -- | $653,915 +3.1% |
| 2002 | -- | $634,202 +2.6% |
| 2001 | $11,015 | $617,845 |
Find assessor info on the county website
Monthly payment
Est. payment
Payment breakdown
Explore the cost of this home by adjusting the details. Changes won't be saved.Climate risks
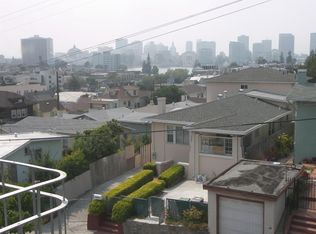
Neighborhood: Ivy Hill


Similar homes
- $3,500,00018 bd6 ba6.4k sqft2445 Harrison St, San Francisco, CA 94110For Sale
 MLS ID #648938, Abdulaziz M. Al-Zamzami. Fresno MLS
- $3,999,99920 bd-- ba9.2k sqft401 Pine Street, Mill Valley, CA 94941For Sale
 MLS ID #326077893, Katherine Y Raphael, Norcal Commercial. BAREIS
- $4,950,00020 bd-- ba8.5k sqft830 Hyde St, San Francisco, CA 94109For Sale
 MLS ID #426165348, Adam D. Filly DRE #01354775, Compass Commercial. SFAR
- $4,698,00018 bd-- ba9.5k sqft1200-1202 Treat Ave, San Francisco, CA 94110For Sale
 MLS ID #426147725, Kim D. Nguyen DRE #01111465, Kim D. Nguyen. SFAR
