Excellent opportunity to invest or build your custom waterfront home in desirable SW Cape Coral! This canal front lot offers beautiful water views and Gulf access. Seawall already in place! City approved building permits and survey available. Conveniently located near shopping, dining, and major roadways.
Active
$215,500
2011 SW 17th Pl, Cape Coral, FL 33991
--beds
--baths
10,018Square Feet
Unimproved Land
Built in ----
10,018 Square Feet Lot
$-- Zestimate®
$--/sqft
$-- HOA
What's special
Gulf accessCanal front lotBeautiful water views
- 4 days
- 53
- 10
Zillow last checked:
Listing updated:
Listed by:
Yaquelin Albuerne Garcia 239-362-7785,
Mamba Realty LLC
Source: Florida Gulf Coast MLS,MLS#: 2026043489 Originating MLS: Florida Gulf Coast
Facts & features
Interior
Video & virtual tour
Property
Features
- Has view: Yes
- View description: Canal
- Has water view: Yes
- Water view: Canal
- Waterfront features: Canal Access
Lot
- Size: 10,018 Square Feet
- Dimensions: 80 x 125 x 80 x 125
- Features: Cleared, Rectangular Lot
- Residential vegetation: Grassed
Details
- Parcel number: 284423C304787.0300
- Lease amount: $0
- Zoning description: R1-W
Utilities & green energy
- Sewer: Assessment Unpaid
- Water: Assessment Unpaid
- Utilities for property: Sewer Available, Water Available
Community & HOA
Community
- Features: Non-Gated
- Condo and coop fee: $0
- Membership fee: $0
- Subdivision: CAPE CORAL
HOA
- Amenities included: None
- Services included: None
Location
- Region: Cape Coral
Financial & listing details
- Tax assessed value: $110,453
- Annual tax amount: $3,060
- Date on market: 10/15/2026
- Listing terms: Cash
- Road surface type: Paved
Estimated market value
Not available
Estimated sales range
Not available
Not available
Price history
| Date | Event | Price |
|---|---|---|
| 10/15/2026 | Listed for sale | $215,500-69.2% |
Source:  Florida Gulf Coast MLS #2026043489 Report a problem | ||
| 3/4/2022 | Listing removed | -- |
Source:  SWFLMLS #221084644 Report a problem | ||
| 12/6/2021 | Listed for sale | $699,000+535.5% |
Source: SWFLMLS #221084644 Report a problem | ||
| 6/17/2021 | Sold | $110,000 |
Source: Florida Gulf Coast MLS #221032581 Report a problem | ||
| 5/23/2021 | Pending sale | $110,000 |
Source:  Florida Gulf Coast MLS #221032581 Report a problem | ||
| 4/30/2021 | Listed for sale | $110,000+189.5% |
Source: Florida Gulf Coast MLS #221032581 Report a problem | ||
| 10/31/2014 | Sold | $38,000-11.2% |
Source: Florida Gulf Coast MLS #214002638 Report a problem | ||
| 5/29/2014 | Price change | $42,800-28.5% |
Source: Barclays Real Estate Group #214002638 Report a problem | ||
| 1/23/2014 | Listed for sale | $59,900+143.5% |
Source: Market America Realty Network #214002638 Report a problem | ||
| 1/9/2014 | Sold | $24,600-8.6% |
Source: Public Record Report a problem | ||
| 11/13/2013 | Price change | $26,900-3.6% |
Source: Gratia Group Real Estate Report a problem | ||
| 11/8/2013 | Listed for sale | $27,900-32.8% |
Source: Gratia Group Real Estate Report a problem | ||
| 8/7/2002 | Sold | $41,500 |
Source: Public Record Report a problem | ||
Public tax history
| Year | Property taxes | Tax assessment |
|---|---|---|
| 2025 | $3,060 +0.8% | $110,453 |
| 2024 | $3,035 +3.9% | $110,453 +3.9% |
| 2023 | $2,921 +7% | $106,317 +8.7% |
| 2022 | $2,729 +59.9% | $97,850 +217.7% |
| 2021 | $1,706 +5.3% | $30,800 +10% |
| 2020 | $1,621 -44.6% | $28,000 -12.5% |
| 2019 | $2,926 | $32,000 |
| 2018 | $2,926 +1.7% | $32,000 +23.8% |
| 2017 | $2,878 +3.9% | $25,840 +12.3% |
| 2016 | $2,769 +2.1% | $23,000 -16.4% |
| 2015 | $2,712 -5.1% | $27,500 +23.9% |
| 2014 | $2,856 +3.2% | $22,200 +11% |
| 2013 | $2,767 +477.8% | $20,000 +17.6% |
| 2012 | $479 -9.8% | $17,000 -14.6% |
| 2011 | $531 -22.7% | $19,900 -23.5% |
| 2010 | $687 +6.2% | $26,000 +4% |
| 2009 | $646 +11% | $25,000 -16.7% |
| 2008 | $582 -67.7% | $30,000 -70% |
| 2007 | $1,802 -48.2% | $100,000 -47.3% |
| 2006 | $3,476 +234.6% | $189,880 +301.4% |
| 2004 | $1,039 +21.8% | $47,300 +28.1% |
| 2003 | $853 +116.2% | $36,920 +132.2% |
| 2002 | $395 | $15,900 +127.8% |
| 2000 | -- | $6,980 |
Find assessor info on the county website
Monthly payment
Climate risks
Neighborhood: 33991


Similar homes
- $224,90010,018 sqft1256 SW 4th St, Cape Coral, FL 33991Lot/Land
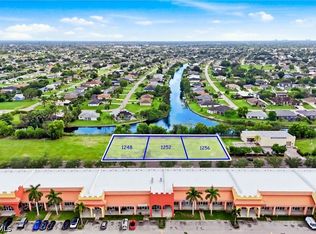
 MLS ID #2026043739, Char Seuffert, Re/Max Sunshine. Florida Gulf Coast MLS
- $124,90010,001 sqft2001 Surfside Blvd, Cape Coral, FL 33991Lot/Land
 MLS ID #2026042491, Ira Hielscher, Cornerstone Coastal Properties. Florida Gulf Coast MLS
- $195,0000.34 acres1721 SW 19th Pl, Cape Coral, FL 33991For Sale By Owner

- $129,90010,018 sqft2111 SW 17th Pl, Cape Coral, FL 33991Lot/Land
 MLS ID #2026022685, Debbie Stack, Century 21 AllPoints Realty. Florida Gulf Coast MLS
- $220,00010,018 sqft1720 SW 17th Ave, Cape Coral, FL 33991Lot/LandMLS ID #2025003225, Therese Nguyen, Century 21 AllPoints Realty. Florida Gulf Coast MLS
- $199,9000.26 acres1504 SW 6th Ter, Cape Coral, FL 33991Lot/LandMLS ID #2026039009, Rachael Guertin, RE/MAX Nautical Realty. Florida Gulf Coast MLS
- $180,00010,018 sqft2106 SW 17th Ave, Cape Coral, FL 33991Lot/LandMLS ID #2025023292, Chrisdyan Linares, John R. Wood Properties. Florida Gulf Coast MLS
- $133,00010,018 sqft2131 SW 17th Pl, Cape Coral, FL 33991New ConstructionMLS ID #2026020678, Joella Consolazio, Properties in Paradise Real Estate, LLC. Florida Gulf Coast MLS
- $250,0000.62 acres1826 SW 15th Pl, Cape Coral, FL 33991New ConstructionMLS ID #2026030048, Joella Consolazio, Properties in Paradise Real Estate, LLC. Florida Gulf Coast MLS
- $200,0000.34 acres1510 SW 7th Ct, Cape Coral, FL 33991Lot/LandMLS ID #2026036169, Amanda Cooper, Re/Max Sunshine. Florida Gulf Coast MLS
- $180,00010,019 sqft2106 SW 17TH AVENUE LOT 5, CAPE CORAL, FL 33991Lot/Land
 MLS ID #C7503159, Chrisdyan Linares, JOHN R. WOOD PROPERTIES. Stellar MLS
- $125,0000.29 acres1433 SW 11th Ct, Cape Coral, FL 33991Lot/LandMLS ID #2026040742, Susanne Enneper-Bahlke, Bahlke Realty LLC. Florida Gulf Coast MLS
- $142,9990.34 acres1818 SW Trafalgar PKWY, CAPE CORAL, FL 33991Lot/Land
 MLS ID #226030705, Kevin Bartlett, Knowledge Base Real Estate. SWFLMLS
- $115,0000.34 acres2236 SW 19th Ave, Cape Coral, FL 33991Lot/LandMLS ID #2026025433, Sofia Skelly, RE/MAX Realty Team. Florida Gulf Coast MLS
- $135,00010,018 sqft403 SW 26th Pl, Cape Coral, FL 33991Lot/LandMLS ID #2026042222, Andres Guarin, Universe Realty Group, Inc. Florida Gulf Coast MLS
- $200,0000.46 acres1617-1621 SW 23rd Ter, Cape Coral, FL 33991Lot/LandMLS ID #2025026443, Nelson Rua, John R. Wood Properties. Florida Gulf Coast MLS
- $126,50010,018 sqft1708 SW 17th Ave, Cape Coral, FL 33991Lot/LandMLS ID #2025010874, Walter Vivancos, Epic Choice Realty Corp. Florida Gulf Coast MLS
- $159,00010,018 sqft1414 SW 1st Pl, Cape Coral, FL 33991Lot/LandMLS ID #2026041622, Michael Alonzo Hernandez, Hustle Bees Realty LLC. Florida Gulf Coast MLS
- $109,99910,628 sqft951 SW 15th PL, CAPE CORAL, FL 33991Lot/LandMLS ID #226030703, Kevin Bartlett, Knowledge Base Real Estate. SWFLMLS
- $225,0000.46 acres2247 SW 17th Pl, Cape Coral, FL 33991Lot/LandMLS ID #2026012963, Dorothy Izzo, John R. Wood Properties. Florida Gulf Coast MLS
