This 1458 square foot single family home has 3 bedrooms and 2.0 bathrooms. This home is located at 2040 Curran St, Oxnard, CA 93033.
Pre-foreclosure
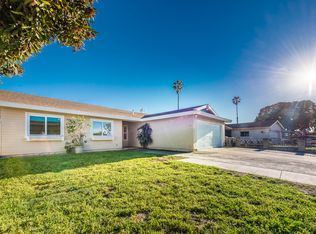
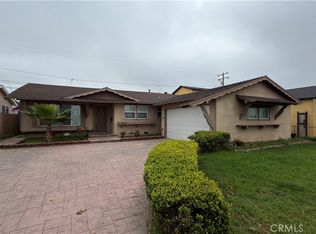
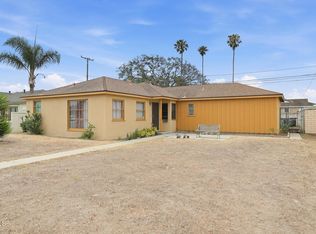
Street View
Est. $730,500
2040 Curran St, Oxnard, CA 93033
3beds
2baths
1,458sqft
SingleFamily
Built in 1968
6,969 Square Feet Lot
$730,500 Zestimate®
$501/sqft
$-- HOA
Overview
- 63 days |
- 153 |
- 3 |
Facts & features
Interior
Bedrooms & bathrooms
- Bedrooms: 3
- Bathrooms: 2
Features
- Has fireplace: Yes
Interior area
- Total interior livable area: 1,458 sqft
Property
Parking
- Parking features: Garage - Attached
Lot
- Size: 6,969 Square Feet
Details
- Parcel number: 2250052015
Construction
Type & style
- Home type: SingleFamily
Condition
- Year built: 1968
Community & HOA
Location
- Region: Oxnard
Financial & listing details
- Price per square foot: $501/sqft
- Tax assessed value: $255,427
- Annual tax amount: $2,922
Visit our professional directory to find a foreclosure specialist in your area that can help with your home search.
Find a foreclosure agentForeclosure details
Estimated market value
$730,500
$694,000 - $767,000
$3,690/mo
Price history
| Date | Event | Price |
|---|---|---|
| 9/28/1998 | Sold | $174,000$119/sqft |
Source: Public Record Report a problem | ||
Public tax history
| Year | Property taxes | Tax assessment |
|---|---|---|
| 2025 | $2,922 +2.5% | $255,427 +2% |
| 2024 | $2,852 | $250,419 +2% |
| 2023 | $2,852 +6.4% | $245,509 +2% |
| 2022 | $2,681 +0.1% | $240,696 +2% |
| 2021 | $2,679 -2.7% | $235,977 +1% |
| 2020 | $2,754 +4% | $233,558 +2% |
| 2019 | $2,648 +1.3% | $228,979 +2% |
| 2018 | $2,613 +2.7% | $224,490 +2% |
| 2017 | $2,545 +4.9% | $220,089 +2% |
| 2016 | $2,427 -1.2% | $215,774 +1.5% |
| 2015 | $2,457 +2.3% | $212,535 +2% |
| 2014 | $2,402 | $208,373 +0.5% |
| 2013 | -- | $207,434 +2% |
| 2012 | -- | $203,367 +2% |
| 2011 | -- | $199,380 +0.5% |
| 2009 | -- | $198,364 +4% |
| 2007 | -- | $190,663 -4.5% |
| 2006 | -- | $199,603 +2% |
| 2005 | -- | $195,690 +3.9% |
| 2003 | -- | $188,340 +2% |
| 2002 | -- | $184,648 +2% |
| 2001 | $1,987 +2.3% | $181,028 +2% |
| 2000 | $1,943 | $177,480 |
Find assessor info on the county website
Monthly payment
Estimated monthly payment$1,822
All calculations are estimates and provided by Zillow, Inc. for informational purposes only. Actual amounts may vary.
HOA fees may include property taxes on listings classified as Co-Ops. Contact the listing agent and/or owner for fee details.
Mortgage interest rates are dependent on a number of factors, including credit score, down payment, and repayment length. Interest rate data provided by Zillow Group Marketplace, Inc. as of 1/1/1970 from various mortgage lenders with which we have lead or other similar arrangements; the Estimated Payment is an average of those rates.
See how much you could borrow to make a competitive offer.
Climate risks
Neighborhood: Tierra Vista
Nearby schools
GreatSchools rating
- 3/10Tierra Vista Elementary SchoolGrades: K-5Distance: 0.3 mi
- 4/10Ocean View Junior High SchoolGrades: 6-8Distance: 0.3 mi
- 4/10Channel Islands High SchoolGrades: 9-12Distance: 0.9 mi


- California
- Ventura County
- Oxnard
- 93033
- Tierra Vista
- 2040 Curran St
Nearby cities
Nearby neighborhoods
Nearby zip codes
Other Oxnard Topics
