Lovely home remodeled in 2021. NewAir, windows, HVAC. This home is adorable! This is an investors dream, great income potential
For sale
Price cut: $2K (9/28)
$152,900
2067 Rankin Ave, Columbus, OH 43219
3beds
864sqft
Single Family Residence
Built in 1955
6,969 Square Feet Lot
$-- Zestimate®
$177/sqft
$-- HOA
What's special
- 87 days
- 212
- 6
Zillow last checked:
Listing updated:
Listed by:
Ruschele R Abbruzzese 614-496-6723,
EXP Realty, LLC
Source: Columbus and Central Ohio Regional MLS ,MLS#: 226028752
Facts & features
Interior
Bedrooms & bathrooms
- Bedrooms: 3
- Bathrooms: 1
- Full bathrooms: 1
- Main level bedrooms: 3
Heating
- Forced Air
Appliances
- Included: Electric Range, Microwave, Refrigerator
Features
- Flooring: Wood, Ceramic/Porcelain
- Common walls with other units/homes: No Common Walls
Interior area
- Total structure area: 864
- Total interior livable area: 864 sqft
Property
Parking
- Parking features: On Street
- Has uncovered spaces: Yes
Features
- Levels: One
Lot
- Size: 6,969 Square Feet
Details
- Parcel number: 010109032
Construction
Type & style
- Home type: SingleFamily
- Property subtype: Single Family Residence
Materials
- Foundation: Slab
Condition
- New construction: No
- Year built: 1955
Utilities & green energy
- Sewer: Public Sewer
- Water: Public
Community & HOA
HOA
- Has HOA: No
Location
- Region: Columbus
Financial & listing details
- Price per square foot: $177/sqft
- Tax assessed value: $89,000
- Annual tax amount: $1,582
- Date on market: 7/30/2026
Estimated market value
Not available
Estimated sales range
Not available
Not available
Price history
| Date | Event | Price |
|---|---|---|
| 9/28/2026 | Price change | $152,900-1.3%$177/sqft |
Source:  Columbus and Central Ohio Regional MLS #226028752 Report a problem | ||
| 8/19/2026 | Price change | $154,900-3.1%$179/sqft |
Source: Columbus and Central Ohio Regional MLS #226028752 Report a problem | ||
| 7/30/2026 | Listed for sale | $159,900+113.2%$185/sqft |
Source: Columbus and Central Ohio Regional MLS #226028752 Report a problem | ||
| 10/12/2023 | Listing removed | -- |
Source: Zillow Rentals Report a problem | ||
| 9/28/2023 | Listed for rent | $1,250$1/sqft |
Source: Zillow Rentals Report a problem | ||
| 3/5/2023 | Listing removed | -- |
Source: Zillow Rentals Report a problem | ||
| 2/19/2023 | Listed for rent | $1,250$1/sqft |
Source: Zillow Rentals Report a problem | ||
| 6/1/2021 | Sold | $75,000+145.1%$87/sqft |
Source: Public Record Report a problem | ||
| 10/1/2018 | Sold | $30,600$35/sqft |
Source: Public Record Report a problem | ||
Public tax history
| Year | Property taxes | Tax assessment |
|---|---|---|
| 2025 | $1,432 +0.3% | $31,150 |
| 2024 | $1,428 +1.3% | $31,150 |
| 2023 | $1,410 +118.3% | $31,150 +156.4% |
| 2022 | $646 -0.2% | $12,150 |
| 2021 | $647 -0.1% | $12,150 |
| 2020 | $648 -2.8% | $12,150 +13.3% |
| 2019 | $667 +0.2% | $10,720 |
| 2018 | $665 | $10,720 |
| 2017 | $665 +64.3% | $10,720 +79.9% |
| 2016 | $405 +9.8% | $5,960 |
| 2015 | $369 | $5,960 |
| 2014 | $369 +72.2% | $5,960 -14.9% |
| 2013 | $214 -72.3% | $7,000 -45.8% |
| 2011 | $773 -12.8% | $12,915 -17.1% |
| 2010 | $887 +6.4% | $15,575 |
| 2008 | $833 +18.7% | $15,575 |
| 2007 | $702 +0.4% | -- |
| 2006 | $700 +4.2% | -- |
| 2005 | $671 +2.3% | -- |
| 2004 | $656 +20.1% | -- |
| 2003 | $546 +0.4% | -- |
| 2002 | $544 +9.4% | -- |
| 2001 | $497 -0.5% | -- |
| 2000 | $500 | -- |
Find assessor info on the county website
Monthly payment
Est. payment
Payment breakdown
Explore the cost of this home by adjusting the details. Changes won't be saved.Climate risks
Neighborhood: Argyle Park


Similar homes
- $165,0003 bd1 ba1.2k sqft2283 Dawnlight Ave, Columbus, OH 43211For Sale
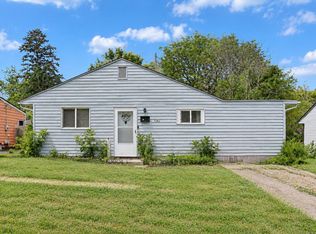
 MLS ID #226039091, Alfath Alim Ahmed, Reafco. Columbus and Central Ohio Regional MLS
- $144,8003 bd1 ba920 sqft2515 Parkwood Ave, Columbus, OH 43211For Sale
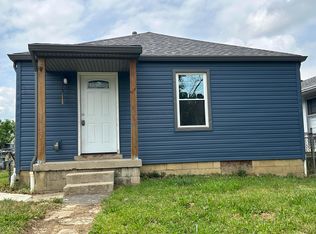 MLS ID #226025423, Richard J Sanford, RE/MAX Achievers. Columbus and Central Ohio Regional MLS
- $144,9002 bd1 ba600 sqft865 Joyce Ave, Columbus, OH 43219For Sale
 MLS ID #226019686, Jennifer Mineau, Agora's Maxxed Out Realty. Columbus and Central Ohio Regional MLS
- $139,9002 bd1 ba672 sqft2922 Atwood Ter, Columbus, OH 43224For Sale
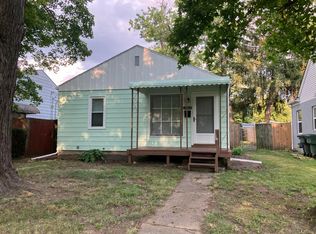 MLS ID #226040543, Aranya McCoy, Howard Hanna Real Estate Svcs. Columbus and Central Ohio Regional MLS
- $149,4002 bd1 ba948 sqft2404 Bancroft St, Columbus, OH 43211For SaleMLS ID #226022326, Corey W Barnes, Villa Real Estate Consultants. Columbus and Central Ohio Regional MLS
- $169,0003 bd2 ba956 sqft2173 Lexington Ave, Columbus, OH 43211For SaleMLS ID #226025618, Jennifer L Seiler, Coldwell Banker Realty. Columbus and Central Ohio Regional MLS
- $149,9002 bd1 ba1k sqft1138 Lexington Ave, Columbus, OH 43201For SaleMLS ID #226028875, Tayler B Mulligan, ROOST Real Estate Co.. Columbus and Central Ohio Regional MLS
- $225,0004 bd1 ba1k sqft2233 Argyle Dr, Columbus, OH 43219For SaleMLS ID #226038258, Blake Park, Reafco. Columbus and Central Ohio Regional MLS
- $159,9002 bd1 ba1.1k sqft1457 Cordell Ave, Columbus, OH 43211For SaleMLS ID #226035134, Yuliya O Kotova, OwnerLand Realty, Inc.. Columbus and Central Ohio Regional MLS
- $150,0002 bd1 ba782 sqft1129 Lexington Ave, Columbus, OH 43201For SaleMLS ID #226037807, Jennifer Mineau, Agora's Maxxed Out Realty. Columbus and Central Ohio Regional MLS
- $135,0002 bd1 ba720 sqft1036 E 20th Ave, Columbus, OH 43211For SaleMLS ID #226035353, Luke R Lumsden, Unique Realty Consultants. Columbus and Central Ohio Regional MLS
- $149,9002 bd1 ba864 sqft2954 Grasmere Ave, Columbus, OH 43224For SaleMLS ID #226035334, Tara L Williams, Vision Realty, Inc.. Columbus and Central Ohio Regional MLS
- $179,9002 bd1 ba756 sqft261 Lowell Rd, Columbus, OH 43209For SaleMLS ID #226040250, Carson D Thrush, List. Columbus and Central Ohio Regional MLS
- $119,0002 bd1 ba686 sqft2237 Parkwood Ave, Columbus, OH 43211For SaleMLS ID #226027592, Tristam Griffith, Cap Rate Realty. Columbus and Central Ohio Regional MLS
- $184,9003 bd2 ba1k sqft3205 Hamilton Ave, Columbus, OH 43224For SaleMLS ID #226029262, Corey W Barnes, Villa Real Estate Consultants. Columbus and Central Ohio Regional MLS
- $134,9972 bd1 ba672 sqft2769 McGuffey Rd, Columbus, OH 43211For SaleMLS ID #226038550, Tristam Griffith, Cap Rate Realty. Columbus and Central Ohio Regional MLS
- $119,9003 bd2 ba988 sqft1208 Minnesota Ave, Columbus, OH 43211For SaleMLS ID #226029881, Tancy A Mason-Phillips, Coldwell Banker Realty. Columbus and Central Ohio Regional MLS
- $168,0003 bd1 ba936 sqft3700 Laguna Dr, Columbus, OH 43232For SaleMLS ID #226040159, Carlos D Ellis, Unique Realty Consultants. Columbus and Central Ohio Regional MLS
