$594,800
-- bd|2 ba|2.7k sqft
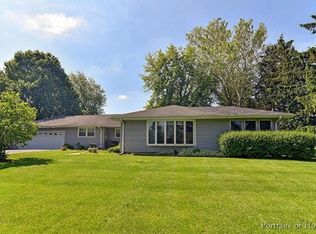
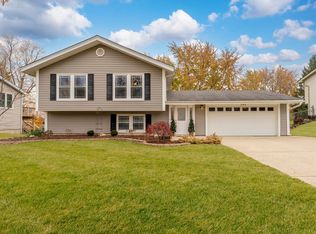
20W385 Diversey Ave, Addison, IL 60101
Off Market
Zillow last checked:
Listing updated:
Debbie Goodale, ABR,CSC,SRES,SRS 815-546-9220,
RE/MAX Plaza
Not available
Estimated sales range
Not available
Not available
| Date | Event | Price |
|---|---|---|
| 6/23/2026 | Contingent | $539,000$234/sqft |
Source: | ||
| 6/23/2026 | Listed for sale | $539,000$234/sqft |
Source: | ||
| 5/31/2026 | Contingent | $539,000$234/sqft |
Source: MRED as distributed by MLS GRID #12579921 Report a problem | ||
| 5/13/2026 | Price change | $539,000-3.6%$234/sqft |
Source: | ||
| 4/27/2026 | Listed for sale | $559,000$243/sqft |
Source: | ||
| 4/23/2026 | Contingent | $559,000$243/sqft |
Source: | ||
| 4/16/2026 | Price change | $559,000-2.8%$243/sqft |
Source: | ||
| 3/31/2026 | Price change | $575,000-3.4%$250/sqft |
Source: | ||
| 3/11/2026 | Listed for sale | $595,000+56.6%$259/sqft |
Source: | ||
| 2/10/2021 | Sold | $380,000-3.8%$165/sqft |
Source: | ||
| 1/11/2021 | Contingent | $395,000$172/sqft |
Source: | ||
| 1/11/2021 | Pending sale | $395,000$172/sqft |
Source: RE/MAX Suburban #10927467 Report a problem | ||
| 11/6/2020 | Price change | $395,000-1.2%$172/sqft |
Source: RE/MAX Suburban #10927467 Report a problem | ||
| 9/27/2020 | Pending sale | $399,900$174/sqft |
Source: Keller Williams Success Realty #10752617 Report a problem | ||
| 8/31/2020 | Listed for sale | $399,900$174/sqft |
Source: Keller Williams Success Realty #10752617 Report a problem | ||
| 8/21/2020 | Pending sale | $399,900$174/sqft |
Source: Keller Williams Success Realty #10752617 Report a problem | ||
| 7/17/2020 | Price change | $399,900-4.6%$174/sqft |
Source: Keller Williams Success Realty #10752617 Report a problem | ||
| 6/19/2020 | Listed for sale | $419,000$182/sqft |
Source: Keller Williams Success Realty #10752617 Report a problem | ||
| Year | Property taxes | Tax assessment |
|---|---|---|
| 2024 | $8,712 +4.8% | $161,462 +8.8% |
| 2023 | $8,314 -0.2% | $148,430 +0.5% |
| 2022 | $8,335 +8.6% | $147,690 +4.4% |
| 2021 | $7,674 +3% | $141,470 +4.4% |
| 2020 | $7,448 -0.4% | $135,510 +4% |
| 2019 | $7,475 -1.9% | $130,300 +2% |
| 2018 | $7,618 +74.7% | $127,750 +4.6% |
| 2017 | $4,361 -5.7% | $122,100 +8.3% |
| 2016 | $4,624 -6.2% | $112,730 +8.2% |
| 2015 | $4,931 -1.1% | $104,140 -1.2% |
| 2014 | $4,988 +4.1% | $105,450 -2% |
| 2013 | $4,793 +8.3% | $107,600 -6.4% |
| 2012 | $4,427 +16.6% | $114,900 -11.9% |
| 2011 | $3,797 +10.5% | $130,430 -3.1% |
| 2010 | $3,436 +12.3% | $134,660 -9.1% |
| 2009 | $3,059 +1.4% | $148,080 |
| 2008 | $3,017 -48.9% | $148,080 +7.6% |
| 2007 | $5,903 +11.6% | $137,620 +10.6% |
| 2006 | $5,288 +6.5% | $124,450 +8% |
| 2005 | $4,966 +55.3% | $115,230 +6.5% |
| 2004 | $3,198 -6.6% | $108,200 +9% |
| 2003 | $3,424 -25.5% | $99,270 +1.9% |
| 2002 | $4,595 +23.1% | $97,390 +8.1% |
| 2001 | $3,733 -1.7% | $90,070 +5.8% |
| 2000 | $3,798 | $85,130 |
Find assessor info on the county website
Source: MRED as distributed by MLS GRID. This data may not be complete. We recommend contacting the local school district to confirm school assignments for this home.
A local agent can set up tours, give advice and negotiate with sellers.
A local lender can help you make sure your offer is ready when you are.