This 1512 square foot single family home has 2 bedrooms and 2.0 bathrooms. This home is located at 2110 W Grace St, Tampa, FL 33607.
Pre-foreclosure
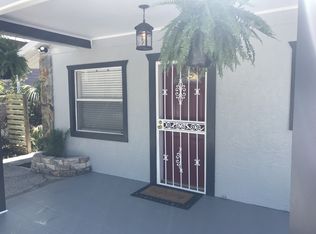
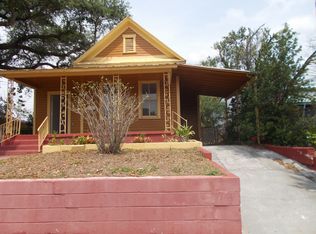
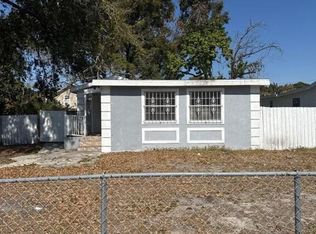
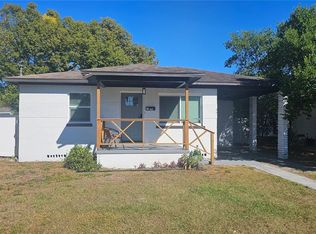
Street View
Est. $394,100
2110 W Grace St, Tampa, FL 33607
2beds
2baths
1,512sqft
SingleFamily
Built in 1983
4,791 Square Feet Lot
$394,100 Zestimate®
$261/sqft
$-- HOA
Overview
- 342 days |
- 13 |
- 0 |
Facts & features
Interior
Bedrooms & bathrooms
- Bedrooms: 2
- Bathrooms: 2
Heating
- Other
Cooling
- Wall
Features
- Flooring: Other, Carpet, Concrete, Hardwood
Interior area
- Total interior livable area: 1,512 sqft
Property
Features
- Exterior features: Cement / Concrete
Lot
- Size: 4,791 Square Feet
Details
- Parcel number: 1829144PE000009000020A
Construction
Type & style
- Home type: SingleFamily
Materials
- masonry
- Roof: Composition
Condition
- Year built: 1983
Community & HOA
Location
- Region: Tampa
Financial & listing details
- Price per square foot: $261/sqft
- Tax assessed value: $280,149
- Annual tax amount: $4,404
Visit our professional directory to find a foreclosure specialist in your area that can help with your home search.
Find a foreclosure agentForeclosure details
Estimated market value
$394,100
$359,000 - $430,000
$3,194/mo
Price history
| Date | Event | Price |
|---|---|---|
| 8/1/2008 | Sold | $62,000$41/sqft |
Source: Public Record Report a problem | ||
Public tax history
| Year | Property taxes | Tax assessment |
|---|---|---|
| 2025 | $4,404 +11.4% | $181,889 +10% |
| 2024 | $3,952 +4.6% | $165,354 +10% |
| 2023 | $3,778 +3.8% | $150,322 +10% |
| 2022 | $3,641 +15.4% | $136,656 +10% |
| 2021 | $3,156 +13.8% | $124,233 +10% |
| 2020 | $2,773 +10.1% | $112,939 +10% |
| 2019 | $2,518 | $102,672 -26.6% |
| 2018 | $2,518 +7.6% | $139,792 +18.3% |
| 2017 | $2,340 +11.5% | $118,201 +83.2% |
| 2016 | $2,099 +37.4% | $64,513 +10% |
| 2015 | $1,527 +27.4% | $58,648 +10% |
| 2014 | $1,199 | $53,316 +10% |
| 2013 | $1,199 +23.5% | $48,469 +10% |
| 2012 | $971 -24.4% | $44,063 -24.6% |
| 2011 | $1,284 -9.8% | $58,477 -10.6% |
| 2010 | $1,424 -20.2% | $65,379 -20% |
| 2009 | $1,785 -29.8% | $81,716 -29.7% |
| 2008 | $2,541 -1.1% | $116,218 -2.3% |
| 2007 | $2,570 -3.3% | $118,950 +5.8% |
| 2006 | $2,658 +31.2% | $112,452 +35.5% |
| 2005 | $2,025 | $82,976 +8.4% |
| 2004 | -- | $76,580 +22.1% |
| 2003 | -- | $62,744 +1.6% |
| 2002 | -- | $61,747 +12.4% |
| 2001 | -- | $54,947 +6.8% |
| 2000 | $1,312 | $51,462 |
Find assessor info on the county website
Monthly payment
Estimated monthly payment$1,822
All calculations are estimates and provided by Zillow, Inc. for informational purposes only. Actual amounts may vary.
HOA fees may include property taxes on listings classified as Co-Ops. Contact the listing agent and/or owner for fee details.
Mortgage interest rates are dependent on a number of factors, including credit score, down payment, and repayment length. Interest rate data provided by Zillow Group Marketplace, Inc. as of 1/1/1970 from various mortgage lenders with which we have lead or other similar arrangements; the Estimated Payment is an average of those rates.
See how much you could borrow to make a competitive offer.
Climate risks
Neighborhood: North Hyde Park
Getting around
35 / 100
Some TransitNearby schools
GreatSchools rating
- 7/10West Tampa Elementary SchoolGrades: PK-5Distance: 0.7 mi
- 5/10Madison Middle SchoolGrades: 6-8Distance: 4 mi
- 3/10Jefferson High SchoolGrades: 9-12Distance: 2.3 mi


- Florida
- Hillsborough County
- Tampa
- 33607
- North Hyde Park
- 2110 W Grace St
Nearby cities
Nearby neighborhoods
Nearby zip codes
Other Tampa Topics
