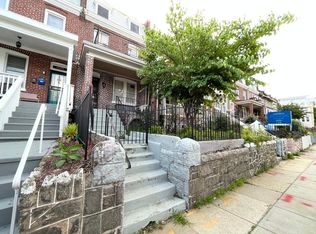
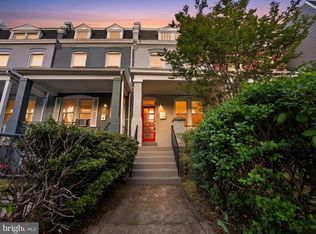
2115 4th St NE, Washington, DC 20002 is a single family home that contains 1,560 sq ft and was built in 1915. It contains 3 bedrooms and 2.5 bathrooms. This home last sold for $999,950 in February 2025.
The Zestimate for this house is $990,900. The Rent Zestimate for this home is $3,420/mo.
Sold for $999,950
$999,950
2115 4th St NE, Washington, DC 20002
3beds
2baths
1,560sqft
SingleFamily
Built in 1915
1,585 Square Feet Lot
$990,900 Zestimate®
$641/sqft
$3,420 Estimated rent
Home value
$990,900
$922,000 - $1.07M
$3,420/mo
Zestimate® history
Loading...
Owner options
List your home for rent
$3,420/mo
Rent Zestimate®
Find your next renter with Zillow Rental Manager. Plus, with online applications, you can quickly screen prospective tenants – for free.
$3,420/mo
Rent Zestimate®
Refinance and save
$5,920/mo
Est. payment
Refinancing to a lower rate could help reduce your monthly payments and save thousands over the life of the loan.
$5,920/mo
Est. payment
Explore your selling options
Work with a Zillow partner agent
Leverage their expertise and Zillow's premium Showcase listings to get your home seen by more buyers.
Get startedList with your own agent
Get your home in front of millions of buyers by listing it on Zillow.
Learn how to do itSell it yourself
Take full control of how buyers see your home on Zillow by listing For Sale by Owner (FSBO).
List your homeWhat's special
Facts & features
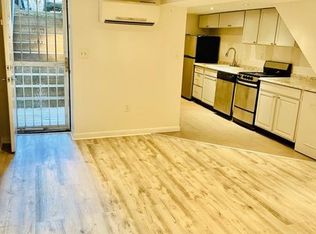
Interior
Bedrooms & bathrooms
- Bedrooms: 3
- Bathrooms: 2.5
Heating
- Other, Other
Features
- Flooring: Hardwood
Interior area
- Total interior livable area: 1,560 sqft
Property
Features
- Exterior features: Brick
Lot
- Size: 1,585 sqft
Details
- Parcel number: 36210032
Construction
Type & style
- Home type: SingleFamily
Materials
- Roof: Built-up
Condition
- Year built: 1915
Community & neighborhood
Location
- Region: Washington
Price history
| Date | Event | Price |
|---|---|---|
| 9/2/2025 | Listing removed | $1,250,000$801/sqft |
Source: | ||
| 6/23/2025 | Listed for sale | $1,250,000+25%$801/sqft |
Source: | ||
| 2/5/2025 | Sold | $999,950+25%$641/sqft |
Source: Public Record Report a problem | ||
| 8/29/2018 | Sold | $800,000+100%$513/sqft |
Source: Public Record Report a problem | ||
| 10/6/2017 | Sold | $400,000$256/sqft |
Source: Public Record Report a problem | ||
Public tax history
| Year | Property taxes | Tax assessment |
|---|---|---|
| 2025 | $7,350 +0.6% | $864,720 +0.6% |
| 2024 | $7,307 +3.8% | $859,630 +3.8% |
| 2023 | $7,039 +2.5% | $828,100 +2.5% |
| 2022 | $6,865 +3.6% | $807,630 +3.6% |
| 2021 | $6,629 +3.4% | $779,860 +3.4% |
| 2020 | $6,411 +49.2% | $754,240 +49.2% |
| 2018 | $4,298 +7.2% | $505,610 +7.2% |
| 2017 | $4,010 +17.1% | $471,770 +17.1% |
| 2016 | $3,425 +20.5% | $402,920 +20.5% |
| 2015 | $2,842 +12.8% | $334,330 +12.8% |
| 2014 | $2,519 +11.6% | $296,380 +11.6% |
| 2013 | $2,257 +0.1% | $265,470 +0.1% |
| 2012 | $2,254 | $265,150 |
| 2011 | $2,254 -13.7% | $265,150 -13.7% |
| 2010 | $2,612 -13.8% | $307,330 -13.8% |
| 2009 | $3,030 +7.5% | $356,470 +11.3% |
| 2007 | $2,817 +18.8% | $320,150 +24.2% |
| 2006 | $2,371 +32.3% | $257,760 +38% |
| 2005 | $1,793 +20.7% | $186,780 +20.7% |
| 2004 | $1,486 +14.8% | $154,750 +14.8% |
| 2003 | $1,294 +18% | $134,800 +18% |
| 2002 | $1,097 -9% | $114,241 +9% |
| 2001 | $1,205 | $104,808 |
Find assessor info on the county website
Neighborhood: Eckington
Nearby schools
GreatSchools rating
- 2/10Langley Elementary SchoolGrades: PK-5Distance: 0.4 mi
- 4/10McKinley Middle SchoolGrades: 6-8Distance: 0.4 mi
- 3/10Dunbar High SchoolGrades: 9-12Distance: 1 mi
Get a cash offer in 3 minutes
Find out how much your home could sell for in as little as 3 minutes with a no-obligation cash offer.
Estimated market value
$990,900
Get a cash offer in 3 minutes
Find out how much your home could sell for in as little as 3 minutes with a no-obligation cash offer.
Estimated market value
$990,900
Nearby cities
Nearby neighborhoods
Nearby zip codes
Other Washington Topics
