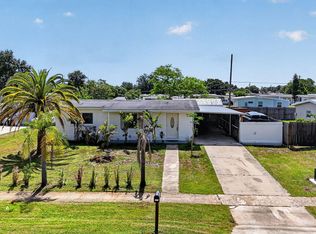
Full of potential! 2 bedroom 1.5 bath home built in 1961. In a centrally located neighborhood, close to shopping, restaurants and golf, this Port Charlotte home has 1,112 sq ft of living space.
Pre-foreclosure
Street View
Est. $141,600
21173 Midway Blvd, Pt Charlotte, FL 33952
2beds
1,112sqft
SingleFamily
Built in 1961
7,405 Square Feet Lot
$141,600 Zestimate®
$127/sqft
$6/mo HOA
Overview
- 41 days
- 11
- 2
Facts & features
Interior
Bedrooms & bathrooms
- Bedrooms: 2
- Bathrooms: 2
- Full bathrooms: 1
- 1/2 bathrooms: 1
Heating
- Forced air, Other, Electric
Cooling
- Central
Appliances
- Included: Dishwasher, Dryer, Microwave, Range / Oven, Refrigerator, Washer
Features
- Flooring: Tile
- Has fireplace: No
Interior area
- Total interior livable area: 1,112 sqft
Property
Parking
- Parking features: Carport
Features
- Exterior features: Other, Cement / Concrete
- Has view: Yes
- View description: City
Lot
- Size: 7,405 Square Feet
Details
- Parcel number: 402215176005
Construction
Type & style
- Home type: SingleFamily
Materials
- Concrete Block
- Foundation: Slab
- Roof: Asphalt
Condition
- Year built: 1961
Community & HOA
HOA
- Has HOA: Yes
- HOA fee: $6 monthly
Location
- Region: Pt Charlotte
Financial & listing details
- Price per square foot: $127/sqft
- Tax assessed value: $155,044
- Annual tax amount: $4,744
Foreclosure details
Estimated market value
$141,600
$113,000 - $167,000
$1,606/mo
Price history
| Date | Event | Price |
|---|---|---|
| 5/18/2012 | Sold | $21,100+6%$19/sqft |
Source: Public Record Report a problem | ||
| 4/3/2012 | Listed for sale | $19,900+30.1%$18/sqft |
Source: American Real Estate #C7033032 Report a problem | ||
| 2/2/2012 | Sold | $15,300-86.7%$14/sqft |
Source: Public Record Report a problem | ||
| 5/5/2006 | Sold | $115,000$103/sqft |
Source: Public Record Report a problem | ||
Public tax history
| Year | Property taxes | Tax assessment |
|---|---|---|
| 2025 | $4,744 +334% | $48,779 +2.9% |
| 2024 | $1,093 +4.4% | $47,404 +3% |
| 2023 | $1,047 +6.1% | $46,023 +3% |
| 2022 | $986 +2% | $44,683 +3% |
| 2021 | $967 +4.2% | $43,382 +1.4% |
| 2020 | $928 +8.9% | $42,783 +2.3% |
| 2019 | $852 +9.8% | $41,821 +1.9% |
| 2018 | $776 | $41,041 +2.1% |
| 2017 | $776 +2.1% | $40,197 +7.7% |
| 2016 | $760 +6.9% | $37,311 +0.7% |
| 2015 | $711 +3.6% | $37,052 +0.8% |
| 2014 | $686 +43.7% | $36,758 +56.8% |
| 2013 | $478 +19.9% | $23,447 +0.5% |
| 2012 | $398 | $23,332 |
| 2011 | -- | $23,332 -21.3% |
| 2010 | $80 -73.9% | $29,657 -32.9% |
| 2009 | $306 | $44,180 -53.1% |
| 2007 | -- | $94,200 |
| 2006 | -- | $94,200 +70.4% |
| 2005 | -- | $55,283 +17.6% |
| 2004 | -- | $47,013 |
| 2003 | -- | $47,013 -0.1% |
| 2002 | $1,031 +11.8% | $47,045 +14.1% |
| 2001 | $921 +6.5% | $41,223 +5.7% |
| 2000 | $865 | $39,015 |
Find assessor info on the county website
Monthly payment
Climate risks
Neighborhood: 33952

Similar homes
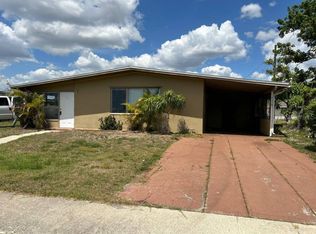
- $--3 bd2 ba888 sqft21920 Beverly Ave, Port Charlotte, FL 33952Auction
 Auction.com 2
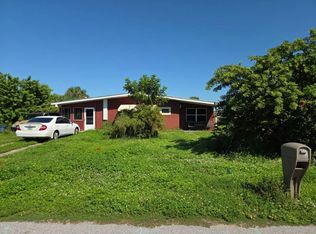
- $--2 bd2 ba1.1k sqft151 Barre Dr NW, Pt Charlotte, FL 33952Auction
 ServiceLink Auction
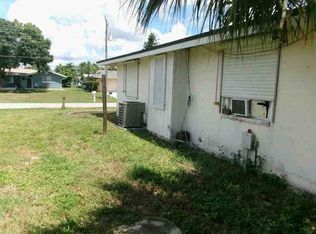
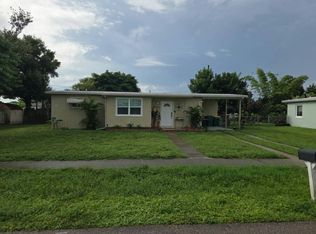
- $--2 bd1 ba735 sqft21371 Meehan Ave, Port Charlotte, FL 33952Auction
 Auction.com 2
- $142,5002 bd1 ba911 sqft2336 Picnic Street, Port Charlotte, FL 33952For Sale
 MLS ID #B26042140, Hayder A Raja, Marlin Realty Inc. BeachesMLS
- $129,9992 bd2 ba962 sqft2313 EDNOR STREET, PORT CHARLOTTE, FL 33952For Sale
 MLS ID #D6149051, Lisa Davis, LISA DAVIS POWERHOUSE REAL ESTATE INC.. Stellar MLS
- $155,0003 bd2 ba1.1k sqft2328 PICNIC STREET, PORT CHARLOTTE, FL 33952For SaleMLS ID #C7531093, Rhonda Gustitus, KW PEACE RIVER PARTNERS. Stellar MLS
- $155,0002 bd1 ba1k sqft21131 BERSELL AVENUE, PORT CHARLOTTE, FL 33952For SaleMLS ID #N6145703, Mark Soravilla, RE/MAX PALM REALTY. Stellar MLS
- $155,0002 bd1 ba1k sqft21115 BERSELL AVENUE, PORT CHARLOTTE, FL 33952For SaleMLS ID #N6145704, Mark Soravilla, RE/MAX PALM REALTY. Stellar MLS
- $155,0002 bd2 ba1.1k sqft20453 MIDWAY BOULEVARD, PORT CHARLOTTE, FL 33952For SaleMLS ID #C7531321, Brian Ziegler, MARINA PARK REALTY LLC. Stellar MLS
- $130,0003 bd2 ba1.1k sqft22195 HERNANDO Avenue, Port Charlotte, FL 33952For SaleMLS ID #B26073880, Audrey A Barr-Keise, Top Floor Realty Group Inc. BeachesMLS
- $155,0002 bd1 ba844 sqft21306 PERCY AVENUE, PORT CHARLOTTE, FL 33952For SaleMLS ID #N6145686, Mark Soravilla, RE/MAX PALM REALTY. Stellar MLS
- $150,0003 bd1 ba756 sqft21050 IONIA AVENUE, PORT CHARLOTTE, FL 33952For SaleMLS ID #C7530186, Nancy Weber, KELLER WILLIAMS ISLAND LIFE REAL ESTATE. Stellar MLS
- $164,9002 bd1 ba897 sqft21061 MIDWAY BOULEVARD, PORT CHARLOTTE, FL 33952For SaleMLS ID #C7529664, Nick Demers, RE/MAX PALM REALTY. Stellar MLS
- $140,0002 bd1 ba735 sqft3100 CRESTWOOD DRIVE, PORT CHARLOTTE, FL 33952For SaleMLS ID #C7529787, Kathy Weithman, CCRFL, LLC.. Stellar MLS
- $154,0002 bd2 ba825 sqft21150 GERTRUDE AVENUE #A3, PORT CHARLOTTE, FL 33952For SaleMLS ID #C7499750, Annia Garcia, DELPHI INVESTMENT REALTY. Stellar MLS
- $184,5003 bd1 ba1.2k sqft21275 Austin AVE, PORT CHARLOTTE, FL 33952For Sale
 MLS ID #226038456, Gloria Trujillo, PA, eXp Realty LLC. SWFLMLS
