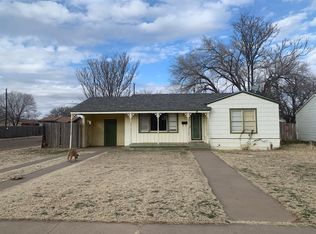
2119 38th 3/1/1 MLS#9991007 $65,000
This property is off market, which means it's not currently listed for sale or rent on Zillow. This may be different from what's available on other websites or public sources.
$106,700
$92,000 - $121,000
$1,172/mo
$1,172/mo
Rent Zestimate®
Find your next renter with Zillow Rental Manager. Plus, with online applications, you can quickly screen prospective tenants – for free.
$1,172/mo
Rent Zestimate®
$586/mo
Est. payment
Refinancing to a lower rate could help reduce your monthly payments and save thousands over the life of the loan.
$586/mo
Est. payment
Work with a Zillow partner agent
Leverage their expertise and Zillow's premium Showcase listings to get your home seen by more buyers.
Get startedList with your own agent
Get your home in front of millions of buyers by listing it on Zillow.
Learn how to do itSell it yourself
Take full control of how buyers see your home on Zillow by listing For Sale by Owner (FSBO).
List your home2119 38th 3/1/1 MLS#9991007 $65,000
This property is off market, which means it's not currently listed for sale or rent on Zillow. This may be different from what's available on other websites or public sources.
| Date | Event | Price |
|---|---|---|
| 5/23/2022 | Sold | -- |
Source: EXIT Realty solds #6462858657922601651 Report a problem | ||
| 4/6/2013 | Listing removed | $65,000$51/sqft |
Source: The Real Estate Book #9991007 Report a problem | ||
| 11/11/2012 | Listed for sale | $65,000-0.8%$51/sqft |
Source: RE/MAX Lubbock #9991007 Report a problem | ||
| 10/1/2011 | Listing removed | $65,500$51/sqft |
Source: NCI #9979932 Report a problem | ||
| 6/17/2011 | Price change | $65,500-5.8%$51/sqft |
Source: RE/MAX Lubbock #9979932 Report a problem | ||
| 5/4/2011 | Listed for sale | $69,500$54/sqft |
Source: RE/MAX Lubbock #9979932 Report a problem | ||
| Year | Property taxes | Tax assessment |
|---|---|---|
| 2025 | $838 -0.6% | $92,861 |
| 2024 | $843 -64.8% | $92,861 -27.9% |
| 2023 | $2,393 +10.5% | $128,728 +20.3% |
| 2022 | $2,166 +20.6% | $106,991 +26.7% |
| 2021 | $1,796 +6.9% | $84,416 +7.6% |
| 2020 | $1,680 +1.6% | $78,427 +3.1% |
| 2019 | $1,653 +5.9% | $76,033 |
| 2018 | $1,561 | $76,033 +9.5% |
| 2017 | $1,561 +7.5% | $69,446 |
| 2016 | $1,453 | $69,446 +12% |
| 2015 | $1,453 | $61,999 -5.1% |
| 2014 | $1,453 | $65,324 +8.9% |
| 2013 | -- | $60,000 -8.2% |
| 2012 | -- | $65,324 |
| 2011 | -- | $65,324 |
| 2010 | -- | $65,324 +5.4% |
| 2009 | -- | $61,999 |
| 2008 | -- | $61,999 +8.3% |
| 2007 | -- | $57,228 +10% |
| 2006 | -- | $52,025 +10% |
| 2005 | -- | $47,295 +6.4% |
| 2004 | -- | $44,465 -6% |
| 2003 | -- | $47,300 +8.6% |
| 2002 | $235 +11.8% | $43,556 +6.6% |
| 2001 | $210 +7.9% | $40,845 |
| 2000 | $195 | $40,845 |
Find assessor info on the county website
An equal housing lender. NMLS #10287.