RECENTLY UPDATED AND MOVE IN READY! Great starter home for new family or excellent addition to an investor’s property portfolio! Home features brand new carpet, updated kitchen and bathroom, fresh paint, new window blinds, new light fixtures, and much more! Roof, HVAC and water heater were replaced in the summer of 2023. House is vacant and being marketed for $1,150/month rent. Homeowner and investor offers considered. Call today!
For sale
$120,000
2120 Bennett Ave, Memphis, TN 38114
3beds
1,100sqft
Single Family Residence
Built in 1970
3,484 Square Feet Lot
$115,400 Zestimate®
$109/sqft
$-- HOA
What's special
Fresh paintBrand new carpetNew window blindsUpdated kitchenNew light fixtures
- 40 days
- 43
- 3
Zillow last checked:
Listing updated:
Listed by:
Jeremy R Veldman,
KAIZEN Realty, LLC 901-221-4041
Source: MAAR,MLS#: 10229994
Facts & features
Interior
Bedrooms & bathrooms
- Bedrooms: 3
- Bathrooms: 1
- Full bathrooms: 1
Primary bedroom
- Area: 100
- Dimensions: 10 x 10
Dining room
- Area: 100
- Dimensions: 10 x 10
Kitchen
- Features: Eat-in Kitchen
Living room
- Area: 100
- Dimensions: 10 x 10
Den
- Area: 100
- Dimensions: 10 x 10
Heating
- Central
Cooling
- Central Air
Features
- All Bedrooms Down, Square Feet Source: AutoFill (MAARdata) or Public Records (Cnty Assessor Site)
- Flooring: Part Carpet
- Has fireplace: No
Interior area
- Total interior livable area: 1,100 sqft
Property
Parking
- Parking features: Driveway/Pad
- Has uncovered spaces: Yes
Features
- Stories: 1
- Patio & porch: Covered Patio
- Pool features: None
Lot
- Size: 3,484 Square Feet
- Dimensions: 38 x 100
- Features: Level
Details
- Parcel number: 047019 00016
Construction
Type & style
- Home type: SingleFamily
- Architectural style: Traditional
- Property subtype: Single Family Residence
Condition
- New construction: No
- Year built: 1970
Community & HOA
Community
- Subdivision: Magnolia Blossom Blk J
Location
- Region: Memphis
Financial & listing details
- Price per square foot: $109/sqft
- Tax assessed value: $130,800
- Annual tax amount: $1,724
- Price range: $120K - $120K
- Date on market: 9/8/2026
Estimated market value
$115,400
$110,000 - $121,000
$1,136/mo
Price history
| Date | Event | Price |
|---|---|---|
| 10/3/2026 | Listed for rent | $1,150$1/sqft |
Source: Zillow Rentals Report a problem | ||
| 9/30/2026 | Listing removed | $1,150$1/sqft |
Source: Zillow Rentals Report a problem | ||
| 9/8/2026 | Listed for sale | $120,000-9%$109/sqft |
Source:  MAAR #10229994 Report a problem | ||
| 7/22/2026 | Listed for rent | $1,150+9.5%$1/sqft |
Source: Zillow Rentals Report a problem | ||
| 3/18/2026 | Listing removed | $1,050$1/sqft |
Source: Zillow Rentals Report a problem | ||
| 3/12/2026 | Price change | $1,050-2.3%$1/sqft |
Source: Zillow Rentals Report a problem | ||
| 3/10/2026 | Price change | $1,075-3.2%$1/sqft |
Source: Zillow Rentals Report a problem | ||
| 1/30/2026 | Price change | $1,110-3.5%$1/sqft |
Source: Zillow Rentals Report a problem | ||
| 10/7/2025 | Listed for rent | $1,150+15.6%$1/sqft |
Source: Zillow Rentals Report a problem | ||
| 2/8/2024 | Sold | $131,900+266.4%$120/sqft |
Source: Public Record Report a problem | ||
| 12/18/2023 | Listing removed | -- |
Source: Zillow Rentals Report a problem | ||
| 11/17/2023 | Listed for rent | $995$1/sqft |
Source: Zillow Rentals Report a problem | ||
| 3/24/2023 | Sold | $36,000+200%$33/sqft |
Source: Public Record Report a problem | ||
| 3/24/2021 | Listing removed | -- |
Source: Owner Report a problem | ||
| 2/14/2019 | Sold | $12,000-7.7%$11/sqft |
Source: Public Record Report a problem | ||
| 1/26/2019 | Price change | $13,000-7.1%$12/sqft |
Source: Owner Report a problem | ||
| 12/26/2018 | Listed for sale | $14,000$13/sqft |
Source: Owner Report a problem | ||
Public tax history
| Year | Property taxes | Tax assessment |
|---|---|---|
| 2025 | $1,724 +67.2% | $32,700 +108.9% |
| 2024 | $1,031 +89% | $15,650 +74.9% |
| 2023 | $545 | $8,950 |
| 2022 | -- | $8,950 |
| 2021 | -- | $8,950 +19.3% |
| 2020 | $240 | $7,500 |
| 2019 | $240 -21.1% | $7,500 |
| 2018 | $304 | $7,500 |
| 2017 | -- | -- |
| 2016 | $354 +34.5% | -- |
| 2014 | $263 | $8,100 |
| 2013 | -- | $8,100 -1.8% |
| 2012 | -- | $8,250 |
| 2011 | -- | $8,250 |
| 2010 | -- | $8,250 |
| 2009 | -- | $8,250 +10.7% |
| 2008 | -- | $7,450 |
| 2007 | -- | $7,450 |
| 2006 | -- | $7,450 |
| 2005 | -- | $7,450 +27.9% |
| 2004 | -- | $5,825 |
| 2003 | -- | $5,825 |
| 2002 | -- | $5,825 |
| 2001 | -- | $5,825 -38.5% |
| 2000 | -- | $9,475 |
Find assessor info on the county website
Monthly payment
Est. payment
Payment breakdown
Explore the cost of this home by adjusting the details. Changes won't be saved.Climate risks
Neighborhood: Midtown

Similar homes
- $100,0003 bd2 ba1k sqft686 Baltimore St, Memphis, TN 38114For Sale
 MLS ID #10226734, Major C Smith, Deberry-Smith Realty LLC. MAAR
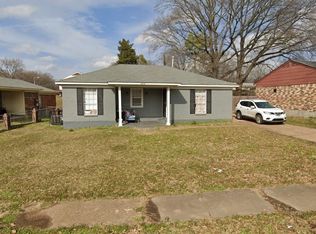
- $129,9003 bd1 ba1k sqft2436 Chattering Ln, Memphis, TN 38127For Sale
 MLS ID #10232455, Jeffry J Goff, Keller Williams. MAAR
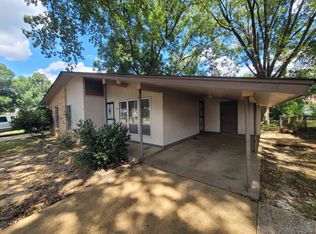
- $115,0003 bd2 ba1k sqft2988 Danville Rd, Memphis, TN 38118For Sale
 MLS ID #10228206, Jay W McMiller, Bespoke Realty. MAAR
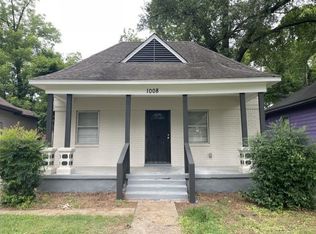
- $150,0004 bd1 ba1k sqft1008 S Willett St, Memphis, TN 38114For Sale
 MLS ID #10225455, Haydn M Wiseman, Cahltrep Realty, LLC. MAAR
