Skip main navigation
Off market
  • Zillow Home logoZestimate®
    $311,000

    2121 N Monitor Ave, Chicago, IL 60639

    2beds
    1,323sqft
    SingleFamily
    Built in 1927
    3,750 Square Feet Lot
    $311,000 Zestimate®
    $235/sqft
    $2,343 Estimated rent

    Home value

    $311,000

    $264,000 - $351,000

    $2,343/mo

    Zestimate® history
    Loading
    Loading...

    Owner options

    List your home for rent

    $2,343/mo

    Rent Zestimate®

    Find your next renter with Zillow Rental Manager. Plus, with online applications, you can quickly screen prospective tenants – for free.

    Learn more

    $2,343/mo

    Rent Zestimate®

    Refinance and save

    $2,293/mo

    Est. payment

    Refinancing to a lower rate could help reduce your monthly payments and save thousands over the life of the loan.

    See today's rates

    $2,293/mo

    Est. payment

    Explore your selling options

    Work with a Zillow partner agent

    Leverage their expertise and Zillow's premium Showcase listings to get your home seen by more buyers.

    Get started

    List with your own agent

    Get your home in front of millions of buyers by listing it on Zillow.

    Learn how to do it

    Sell it yourself

    Take full control of how buyers see your home on Zillow by listing For Sale by Owner (FSBO).

    List your home

    What's special

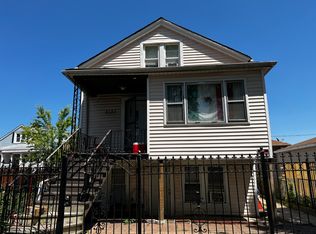
    A starter house that needs work. One large BR on the first floor, basement is finished with a bedroom, bath and a summer kitchen. One car attached garage, carport for one car plus a newer two car garage on the front of the house. The house is at the back of the lot. Cash offers only. Sold as is. Submit all offers.

    This property is not currently displayed as for sale or rent on Zillow. This may be different from what's on other websites or public sources.

    Facts & features

    Interior

    Bedrooms & bathrooms
    • Bedrooms: 2
    • Bathrooms: 2
    • Full bathrooms: 1
    • 1/2 bathrooms: 1
    Heating
    • Forced air, Gas
    Cooling
    • None
    Interior area
    • Total interior livable area: 1,323 sqft

    Property

    Parking
    • Parking features: Garage - Attached
    Features
    • Exterior features: Stone
    Lot
    • Size: 3,750 Square Feet
    Details
    • Parcel number: 1332222018

    Construction

    Type & style
    • Home type: SingleFamily
    Materials
    • Roof: Shake / Shingle
    Condition
    • Year built: 1927

    Utilities & green energy

    • Sewer: Sewer-Public

    Community & HOA

    Location
    • Region: Chicago

    Financial & listing details

    • Price per square foot: $235/sqft
    • Tax assessed value: $250,010
    • Annual tax amount: $4,363

    Price history

    DateEventPrice
    1/5/2017Sold$71,000-10.1%$54/sqft
    Source: MRED as distributed by MLS GRID #09078035 Report a problem
    8/17/2016Pending sale$79,000$60/sqft
    Source: Keller Williams - Park Ridge #09078035 Report a problem
    7/18/2016Listed for sale$79,000$60/sqft
    Source: Keller Williams - Park Ridge #09078035 Report a problem
    3/23/2016Pending sale$79,000$60/sqft
    Source: Keller Williams - Park Ridge #09078035 Report a problem
    12/29/2015Listed for sale$79,000$60/sqft
    Source: Keller Williams Realty Ptnr LL #09078035 Report a problem
    12/29/2015Pending sale$79,000$60/sqft
    Source: Keller Williams Realty Ptnr LL #09078035 Report a problem
    12/24/2015Price change$79,000-11.2%$60/sqft
    Source: Keller Williams - Park Ridge #09078035 Report a problem
    11/11/2015Price change$89,000-10.1%$67/sqft
    Source: Keller Williams - Park Ridge #09078035 Report a problem
    11/3/2015Listed for sale$99,000+7.6%$75/sqft
    Source: Keller Williams Realty Ptnr LL #09078035 Report a problem
    5/30/1997Sold$92,000$70/sqft
    Source: Public Record Report a problem

    Public tax history

    YearProperty taxesTax assessment
    2024$4,363 +31.8%$25,001 +31.6%
    2023$3,311 +3.3%$19,000
    2022$3,206 +1.7%$19,000
    2021$3,153 +0.1%$19,000 +10.2%
    2020$3,151 -5.7%$17,240 -14%
    2019$3,341 +1.7%$20,047
    2018$3,283 -13.1%$20,047 -4.2%
    2017$3,778 +2.4%$20,915
    2016$3,691 +10.1%$20,915
    2015$3,354 -15.9%$20,915 -13%
    2014$3,988 +2.3%$24,046
    2013$3,898 +0.7%$24,046
    2012$3,870 +7%$24,046 -8.7%
    2011$3,616 +3.3%$26,335
    2010$3,499 +9.9%$26,335
    2009$3,184 +6.7%$26,335 -4.3%
    2008$2,985 +1.2%$27,508 -8%
    2007$2,950 -31.3%$29,897
    2006$4,295 +43.9%$29,897 +63.8%
    2005$2,986 +1%$18,256
    2004$2,955 +2.2%$18,256
    2003$2,892 +31.4%$18,256 +49.2%
    2002$2,201 +24.2%$12,240
    2001$1,773 +13.1%$12,240
    2000$1,567 -20.3%$12,240 +20.7%
    1999$1,965 $10,141
    Find assessor info on the county website

    Neighborhood: Belmont Central

    Nearby schools

    GreatSchools rating
    Get a cash offer in 3 minutes
    Find out how much your home could sell for in as little as 3 minutes with a no-obligation cash offer.
    Estimated market value
    $311,000
    Get a cash offer in 3 minutes
    Find out how much your home could sell for in as little as 3 minutes with a no-obligation cash offer.
    Estimated market value
    $311,000