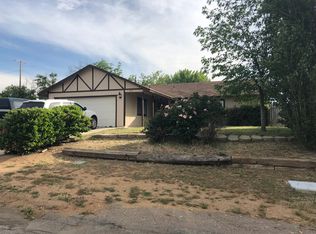
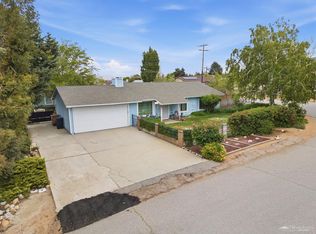
This 1088 square foot single family home has 2 bedrooms and 2.0 bathrooms. This home is located at 21220 Mission St, Tehachapi, CA 93561.
Pre-foreclosure
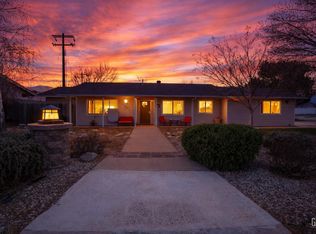
Street View
Est. $325,100
21220 Mission St, Tehachapi, CA 93561
2beds
2baths
1,088sqft
SingleFamily
Built in 1984
7,840 Square Feet Lot
$325,100 Zestimate®
$299/sqft
$-- HOA
Overview
- 46 days |
- 89 |
- 2 |
Facts & features
Interior
Bedrooms & bathrooms
- Bedrooms: 2
- Bathrooms: 2
Heating
- Other
Cooling
- Other
Features
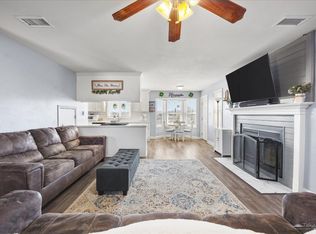
- Has fireplace: Yes
Interior area
- Total interior livable area: 1,088 sqft
Property
Parking
- Parking features: Garage - Attached
Lot
- Size: 7,840 Square Feet
Details
- Parcel number: 46811001
Construction
Type & style
- Home type: SingleFamily
Materials
- wood frame
Condition
- Year built: 1984
Community & HOA
Location
- Region: Tehachapi
Financial & listing details
- Price per square foot: $299/sqft
- Tax assessed value: $281,335
- Annual tax amount: $3,330
Visit our professional directory to find a foreclosure specialist in your area that can help with your home search.
Find a foreclosure agentForeclosure details
Estimated market value
$325,100
$306,000 - $341,000
$1,857/mo
Price history
| Date | Event | Price |
|---|---|---|
| 9/7/2006 | Sold | $210,000+110%$193/sqft |
Source: Public Record Report a problem | ||
| 6/27/2006 | Sold | $100,000-25.9%$92/sqft |
Source: Public Record Report a problem | ||
| 4/30/2004 | Sold | $135,000+80%$124/sqft |
Source: Public Record Report a problem | ||
| 6/8/1994 | Sold | $75,000$69/sqft |
Source: Public Record Report a problem | ||
Public tax history
| Year | Property taxes | Tax assessment |
|---|---|---|
| 2025 | $3,330 +0.8% | $281,335 +2% |
| 2024 | $3,303 +3.8% | $275,820 +2% |
| 2023 | $3,183 +1% | $270,413 +2% |
| 2022 | $3,151 | $265,111 +23.9% |
| 2021 | -- | $214,000 +6.5% |
| 2020 | $2,441 +11.5% | $201,000 +13.6% |
| 2019 | $2,190 +10.4% | $177,000 +8.6% |
| 2018 | $1,984 +9% | $163,000 +10.9% |
| 2017 | $1,821 +11.4% | $147,000 +10.5% |
| 2016 | $1,634 +8.4% | $133,000 +4.7% |
| 2015 | $1,508 +14.5% | $127,000 +15.5% |
| 2014 | $1,317 | $110,000 +17% |
| 2013 | -- | $94,000 -3.5% |
| 2012 | $1,115 +0.2% | $97,425 |
| 2011 | $1,113 -9% | $97,425 -8.9% |
| 2010 | $1,223 -16.4% | $107,000 -15.7% |
| 2009 | $1,463 -26.8% | $126,911 -25.9% |
| 2008 | $1,999 -18.4% | $171,344 -18.4% |
| 2007 | $2,451 +49.2% | $210,000 +49.5% |
| 2006 | $1,643 -5.5% | $140,453 +2% |
| 2005 | $1,739 +63.2% | $137,700 +50.6% |
| 2004 | $1,065 +2.8% | $91,445 +1.9% |
| 2003 | $1,037 | $89,770 +4% |
| 2002 | $1,037 +6.3% | $86,286 +2% |
| 2001 | $976 | $84,595 |
| 2000 | -- | $84,595 |
Find assessor info on the county website
Monthly payment
Estimated monthly payment$1,822
All calculations are estimates and provided by Zillow, Inc. for informational purposes only. Actual amounts may vary.
HOA fees may include property taxes on listings classified as Co-Ops. Contact the listing agent and/or owner for fee details.
Mortgage interest rates are dependent on a number of factors, including credit score, down payment, and repayment length. Interest rate data provided by Zillow Group Marketplace, Inc. as of 1/1/1970 from various mortgage lenders with which we have lead or other similar arrangements; the Estimated Payment is an average of those rates.
See how much you could borrow to make a competitive offer.
Climate risks
Neighborhood: Golden Hills
Nearby schools
GreatSchools rating
- 5/10Golden Hills Elementary SchoolGrades: K-5Distance: 0.2 mi
- 2/10Jacobsen Middle SchoolGrades: 6-8Distance: 3.2 mi
- 5/10Tehachapi High SchoolGrades: 9-12Distance: 3.3 mi

- California
- Kern County
- Tehachapi
- 93561
- Golden Hills
- 21220 Mission St
Nearby cities
Nearby neighborhoods
Nearby zip codes
Other Tehachapi Topics
