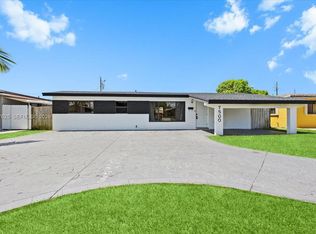
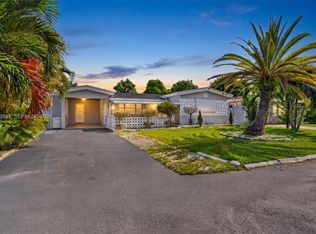
This 1784 square foot single family home has 3 bedrooms and 2.0 bathrooms. This home is located at 2141 SW 67th Way, Miramar, FL 33023.
Pre-foreclosure
Street View
Est. $513,600
2141 SW 67th Way, Miramar, FL 33023
3beds
2baths
1,784sqft
SingleFamily
Built in 1968
7,000 Square Feet Lot
$513,600 Zestimate®
$288/sqft
$-- HOA
Overview
- 357 days |
- 6 |
- 0 |
Facts & features
Interior
Bedrooms & bathrooms
- Bedrooms: 3
- Bathrooms: 2
Features
- Flooring: Tile, Concrete
Interior area
- Total interior livable area: 1,784 sqft
Property
Features
- Exterior features: Stucco, Cement / Concrete
Lot
- Size: 7,000 Square Feet
Details
- Parcel number: 514123180740
Construction
Type & style
- Home type: SingleFamily
Materials
- masonry
- Foundation: Other
- Roof: Shake / Shingle
Condition
- Year built: 1968
Community & HOA
Location
- Region: Miramar
Financial & listing details
- Price per square foot: $288/sqft
- Tax assessed value: $481,030
- Annual tax amount: $4,482
Visit our professional directory to find a foreclosure specialist in your area that can help with your home search.
Find a foreclosure agentForeclosure details
Estimated market value
$513,600
$473,000 - $550,000
$3,754/mo
Price history
| Date | Event | Price |
|---|---|---|
| 12/11/2000 | Sold | $113,500+19.6%$64/sqft |
Source: Public Record Report a problem | ||
| 12/20/1994 | Sold | $94,900+42.1%$53/sqft |
Source: Public Record Report a problem | ||
| 4/1/1988 | Sold | $66,786$37/sqft |
Source: Public Record Report a problem | ||
Public tax history
| Year | Property taxes | Tax assessment |
|---|---|---|
| 2025 | $4,482 +2.8% | $119,240 +2.9% |
| 2024 | $4,360 +1.3% | $115,880 +3% |
| 2023 | $4,306 +4.8% | $112,510 +3% |
| 2022 | $4,109 +129.6% | $109,240 +3% |
| 2021 | $1,790 +1.4% | $106,060 +1.4% |
| 2020 | $1,766 +1.6% | $104,600 +2.3% |
| 2019 | $1,737 | $102,250 +1.9% |
| 2018 | $1,737 +4.9% | $100,350 +2.1% |
| 2017 | $1,657 +4.6% | $98,290 +2.1% |
| 2016 | $1,584 +0.8% | $96,270 +0.7% |
| 2015 | $1,571 +1.8% | $95,610 +0.8% |
| 2014 | $1,543 +3.3% | $94,860 -10.5% |
| 2013 | $1,494 +8.8% | $106,020 +15.4% |
| 2012 | $1,372 -16.6% | $91,900 -22.7% |
| 2011 | $1,646 -1.5% | $118,870 +9.9% |
| 2010 | $1,670 -46.2% | $108,150 -38.5% |
| 2009 | $3,106 -18.4% | $175,840 -20.1% |
| 2008 | $3,807 -23% | $219,950 -7% |
| 2007 | $4,946 +14.5% | $236,380 +28.8% |
| 2006 | $4,321 | $183,550 +17.6% |
| 2005 | -- | $156,100 +24.1% |
| 2004 | $3,237 +9.8% | $125,760 +8.1% |
| 2003 | $2,947 +20.8% | $116,330 +23.6% |
| 2002 | $2,440 +5% | $94,130 +5.3% |
| 2001 | $2,324 +86.1% | $89,420 |
| 2000 | $1,249 | -- |
Find assessor info on the county website
Monthly payment
Estimated monthly payment$1,822
All calculations are estimates and provided by Zillow, Inc. for informational purposes only. Actual amounts may vary.
HOA fees may include property taxes on listings classified as Co-Ops. Contact the listing agent and/or owner for fee details.
Mortgage interest rates are dependent on a number of factors, including credit score, down payment, and repayment length. Interest rate data provided by Zillow Group Marketplace, Inc. as of 1/1/1970 from various mortgage lenders with which we have lead or other similar arrangements; the Estimated Payment is an average of those rates.
See how much you could borrow to make a competitive offer.
Climate risks
Neighborhood: Welwyn
Nearby schools
GreatSchools rating
- 8/10Miramar Elementary SchoolGrades: PK-5Distance: 0.3 mi
- 5/10New Renaissance Middle SchoolGrades: 6-8Distance: 4.2 mi
- 4/10Miramar High SchoolGrades: 9-12Distance: 2.7 mi


- Florida
- Broward County
- Miramar
- 33023
- Welwyn
- 2141 SW 67th Way
Nearby cities
Nearby neighborhoods
Nearby zip codes
Other Miramar Topics
