Great investment opportunity! This side-by-side duplex offers 3 bedrooms and 1 bathroom in each unit and is fully occupied, providing immediate rental income. Tenants are responsible for gas and electric, while the owner covers water, trash, and lawn care. A fantastic opportunity to add an income-producing property to your investment portfolio!
Active
$165,000
215-217 Warren Dr, Springfield, OH 45503
6beds
2,352sqft
Multi Family
Built in 1911
-- sqft lot
$154,800 Zestimate®
$70/sqft
$-- HOA
What's special
- 40 days
- 151
- 12
Zillow last checked:
Listing updated:
Listed by:
Brittany Drake 513-255-2886,
eXp Realty
Source: WRIST,MLS#: 1049033
Facts & features
Interior
Bedrooms & bathrooms
- Bedrooms: 6
- Bathrooms: 2
- Full bathrooms: 2
Heating
- Forced Air, Natural Gas
Features
- Basement: Full
- Has fireplace: No
Interior area
- Total structure area: 2,352
- Total interior livable area: 2,352 sqft
Video & virtual tour
Property
Features
- Levels: Two
- Stories: 2
Lot
- Size: 2,178 Square Feet
- Dimensions: 42 x 58
- Features: Residential Lot
Details
- Parcel number: 3400700036407002
- Zoning description: Residential
Construction
Type & style
- Home type: MultiFamily
- Property subtype: Multi Family
Materials
- Vinyl Siding
- Foundation: Block
Condition
- Year built: 1911
Utilities & green energy
- Sewer: Public Sewer
- Water: Supplied Water
- Utilities for property: Natural Gas Connected, Separate Meters
Community & HOA
Community
- Subdivision: Marion
Location
- Region: Springfield
Financial & listing details
- Price per square foot: $70/sqft
- Tax assessed value: $131,820
- Annual tax amount: $2,053
- Date on market: 10/9/2026
- Listing terms: 1031 Exchange,Cash,Conventional
Estimated market value
$154,800
$147,000 - $163,000
$1,059/mo
Price history
| Date | Event | Price |
|---|---|---|
| 10/9/2026 | Listed for sale | $165,000+11.9%$70/sqft |
Source:  WRIST #1049033 Report a problem | ||
| 4/28/2026 | Sold | $147,500+145.8%$63/sqft |
Source: Public Record Report a problem | ||
| 4/28/2026 | Listing removed | $995 |
Source: Zillow Rentals Report a problem | ||
| 4/9/2026 | Listed for rent | $995 |
Source: Zillow Rentals Report a problem | ||
| 5/31/2019 | Sold | $60,000$26/sqft |
Source: WRIST #426582 Report a problem | ||
| 4/19/2019 | Pending sale | $60,000$26/sqft |
Source: Glasshouse Realty Group LLC #426582 Report a problem | ||
| 4/17/2019 | Listed for sale | $60,000-16.7%$26/sqft |
Source: Glasshouse Realty Group LLC #426582 Report a problem | ||
| 4/28/2010 | Sold | $72,000+200%$31/sqft |
Source: Public Record Report a problem | ||
| 8/2/2000 | Sold | $24,000$10/sqft |
Source: Public Record Report a problem | ||
Public tax history
| Year | Property taxes | Tax assessment |
|---|---|---|
| 2025 | $2,053 +22.4% | $46,130 +39.4% |
| 2024 | $1,677 +2.6% | $33,090 |
| 2023 | $1,634 -2.4% | $33,090 |
| 2022 | $1,674 +9.6% | $33,090 +19% |
| 2021 | $1,528 -0.2% | $27,800 |
| 2020 | $1,531 -0.2% | $27,800 |
| 2019 | $1,535 +30.3% | $27,800 +35.7% |
| 2018 | $1,178 | $20,480 0% |
| 2017 | $1,178 -0.1% | $20,483 |
| 2016 | $1,179 -1.9% | $20,483 |
| 2015 | $1,202 | $20,483 |
| 2014 | $1,202 +1.5% | $20,483 |
| 2013 | $1,184 -1.8% | $20,483 -5.7% |
| 2012 | $1,206 -2% | $21,714 |
| 2011 | $1,230 +7.7% | $21,714 |
| 2010 | $1,142 -6.4% | $21,714 -12% |
| 2009 | $1,220 +3% | $24,675 |
| 2008 | $1,185 -12.5% | $24,675 -13.7% |
| 2007 | $1,354 +6.1% | $28,578 +14.3% |
| 2006 | $1,276 +135.5% | $25,012 |
| 2005 | $542 -72% | $25,012 +0% |
| 2004 | $1,938 +7.1% | $25,010 +9% |
| 2003 | $1,810 -0.2% | $22,950 |
| 2002 | $1,813 +19.1% | $22,950 +17.8% |
| 2000 | $1,522 | $19,490 |
Find assessor info on the county website
Monthly payment
Est. payment
Payment breakdown
Explore the cost of this home by adjusting the details. Changes won't be saved.Climate risks
Neighborhood: 45503


Similar homes
- $160,0006 bd2 ba2.3k sqft509-511 E Northern Ave, Springfield, OH 45503For Sale
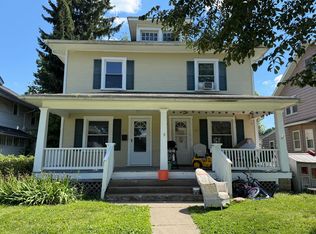
 MLS ID #1046616, Tina Bleything, Roost Real Estate Co.. WRIST
- $184,9006 bd4 ba2.5k sqft551-553 E Cassilly St, Springfield, OH 45503For Sale
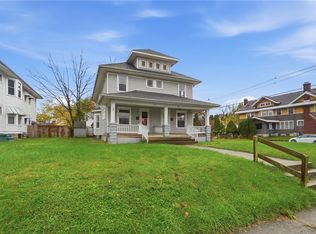
 MLS ID #970247, Tamara Comer, Coldwell Banker Heritage. DABR MLS
- $163,5004 bd2 ba1.7k sqft1143 Cedarview Dr, Springfield, OH 45503For Sale
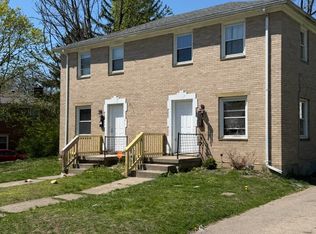 MLS ID #1044777, Marla Morland, e-Merge Real Estate. WRIST
- $179,0006 bd2 ba2.5k sqft1001-1003 Garfield Ave, Springfield, OH 45504For Sale
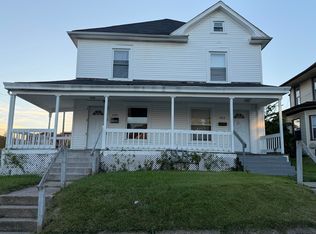 MLS ID #1049218, Tina Bleything, Roost Real Estate Co.. WRIST
- $155,0004 bd2 ba2.8k sqft836-838 Rodgers Dr, Springfield, OH 45503For SaleMLS ID #1049043, Tina Benton, Sibcy Cline, Inc.. WRIST
- $179,0006 bd2 ba3k sqft557-559 E Madison Ave, Springfield, OH 45503For SaleMLS ID #1046563, Tina Bleything, Roost Real Estate Co.. WRIST
- $179,0007 bd3 ba3.2k sqft457-459 E Madison Ave, Springfield, OH 45503For SaleMLS ID #1046562, Tina Bleything, Roost Real Estate Co.. WRIST
- $187,9004 bd2 ba1.7k sqft1309-1311 W Cedarview Dr, Springfield, OH 45503For SaleMLS ID #1048352, Linda M. Schutte, Key Realty. WRIST
- $154,9004 bd2 ba2.1k sqft1832 Warder St, Springfield, OH 45503For SaleMLS ID #968822, Morgan Coles, Coldwell Banker Heritage. DABR MLS
- $180,9604 bd2 ba1.6k sqft2351 Kingswood Dr W, Springfield, OH 45503AuctionMLS ID #1049673, Jeff S. Harvey, Harvey Plus. WRIST
- $155,0006 bd2 ba2.8k sqft1725-1727 W High St, Springfield, OH 45506For SaleMLS ID #1047668, Tina Bleything, Roost Real Estate Co.. WRIST
- $174,9004 bd2 ba1.7k sqft816 Homestead Ave, Springfield, OH 45503For SaleMLS ID #971635, Arthur Solomon, Coldwell Banker Heritage. DABR MLS
- $154,9004 bd2 ba2.3k sqft1508 Maiden Ln, Springfield, OH 45504For SaleMLS ID #1049419, Morgan Coles, Coldwell Banker Heritage. WRIST
- $148,9004 bd2 ba1.8k sqft412 E Madison Ave, Springfield, OH 45503For SaleMLS ID #972165, Dylan Cassidy, Howard Hanna Real Estate Serv. DABR MLS
- $170,0003 bd3 ba1.8k sqft705 E Cassilly St, Springfield, OH 45503For SaleMLS ID #960148, E. Lee Henderson, Henderson Land Investment Co. DABR MLS
- $138,9005 bd3 ba2.4k sqft3753 W National Rd, Springfield, OH 45504For SaleMLS ID #973028, Rachel Gannon, Local Roots Realty. DABR MLS
- $185,0005 bd3 ba3.3k sqft126 E Cassilly St, Springfield, OH 45504For SaleMLS ID #956418, John M Kiefaber, Howard Hanna Real Estate Serv. DABR MLS
