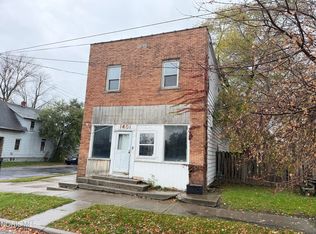
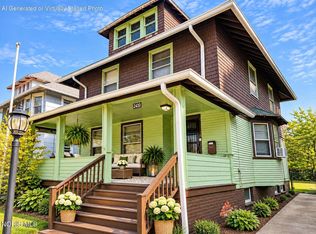
$1,600
-- bd-- ba-- sqft
2148 Maplewood Ave, Toledo, OH 43620
Off Market
Likely to sell faster than
Zillow last checked:
Listing updated:
Gerald McKibben 419-902-7902,
Serenity Realty LLC,
Brianne Francis 567-868-8169,
Serenity Realty LLC
Not available
Estimated sales range
Not available
$1,148/mo
| Date | Event | Price |
|---|---|---|
| 11/3/2026 | Price change | $58,000-22.7%$16/sqft |
Source: NORIS #10014104 Report a problem | ||
| 9/30/2026 | Listed for sale | $75,000+57.9%$21/sqft |
Source: NORIS #10014104 Report a problem | ||
| 1/19/2025 | Listing removed | $1,100 |
Source: Zillow Rentals Report a problem | ||
| 12/25/2024 | Listed for rent | $1,100 |
Source: Zillow Rentals Report a problem | ||
| 12/21/2024 | Listing removed | $1,100 |
Source: Zillow Rentals Report a problem | ||
| 12/20/2024 | Listed for rent | $1,100 |
Source: Zillow Rentals Report a problem | ||
| 8/5/2021 | Sold | $47,500+97.9%$13/sqft |
Source: Public Record Report a problem | ||
| 3/7/2007 | Sold | $24,000-55%$7/sqft |
Source: Public Record Report a problem | ||
| 12/15/2006 | Sold | $53,334-33.3%$15/sqft |
Source: Public Record Report a problem | ||
| 5/1/2002 | Sold | $80,000$22/sqft |
Source: Public Record Report a problem | ||
| Year | Property taxes | Tax assessment |
|---|---|---|
| 2025 | $2,861 -20.6% | $41,825 |
| 2024 | $3,605 +85% | $41,825 +41.1% |
| 2023 | $1,949 -32.4% | $29,645 |
| 2022 | $2,883 -1.7% | $29,645 |
| 2021 | $2,932 +2.8% | $29,645 +18.3% |
| 2020 | $2,851 -78% | $25,060 |
| 2019 | $12,984 +362.5% | $25,060 |
| 2018 | $2,807 +34.8% | $25,060 -5.9% |
| 2017 | $2,082 +0.1% | $26,635 -65% |
| 2016 | $2,080 +0.9% | $76,100 |
| 2015 | $2,061 -20.2% | $76,100 +185.7% |
| 2014 | $2,583 +50% | $26,640 |
| 2013 | $1,722 +4.1% | $26,640 |
| 2012 | $1,653 -1.7% | $26,640 -7.1% |
| 2011 | $1,682 -46.7% | $28,670 |
| 2010 | $3,157 -13.5% | $28,670 +8.2% |
| 2009 | $3,651 +104.9% | $26,500 -20% |
| 2008 | $1,781 -30.9% | $33,110 |
| 2007 | $2,578 -73.4% | $33,110 |
| 2006 | $9,703 +365.4% | $33,110 +17.3% |
| 2004 | $2,085 +49.5% | $28,220 |
| 2003 | $1,394 -30% | $28,220 +22% |
| 2002 | $1,991 +75.9% | $23,140 |
| 2001 | $1,132 -44.2% | $23,140 |
| 2000 | $2,029 | $23,140 |
Source: NORIS. This data may not be complete. We recommend contacting the local school district to confirm school assignments for this home.
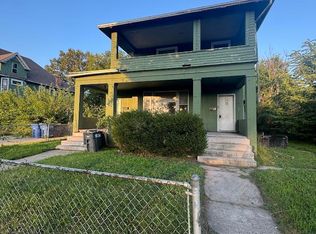
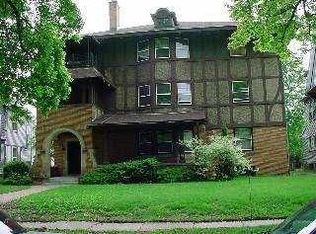
A local agent can set up tours, give advice and negotiate with sellers.