Skip main navigation
Off market
  • $228,500

    2157 W 115th St, Chicago, IL 60643

    --beds
    --baths
    --sqft
    SingleFamily
    Built in 1920
    10,300 Square Feet Lot
    $228,500 Zestimate®
    $--/sqft
    $2,853 Estimated rent

    Home value

    $228,500

    $192,000 - $260,000

    $2,853/mo

    Zestimate® history
    Loading
    Loading...

    Owner options

    List your home for rent

    $2,853/mo

    Rent Zestimate®

    Find your next renter with Zillow Rental Manager. Plus, with online applications, you can quickly screen prospective tenants – for free.

    Learn more

    $2,853/mo

    Rent Zestimate®

    Refinance and save

    $1,678/mo

    Est. payment

    Refinancing to a lower rate could help reduce your monthly payments and save thousands over the life of the loan.

    See today's rates

    $1,678/mo

    Est. payment

    Explore your selling options

    Work with a Zillow partner agent

    Leverage their expertise and Zillow's premium Showcase listings to get your home seen by more buyers.

    Get started

    List with your own agent

    Get your home in front of millions of buyers by listing it on Zillow.

    Learn how to do it

    Sell it yourself

    Take full control of how buyers see your home on Zillow by listing For Sale by Owner (FSBO).

    List your home

    What's special

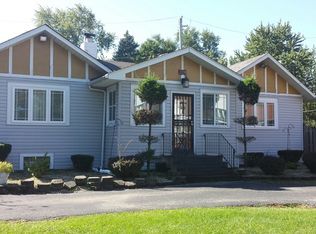
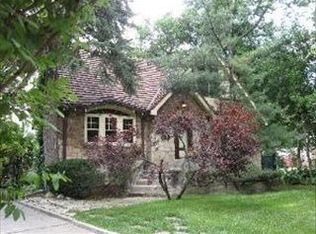
    This is a single family home. This home is located at 2157 W 115th St, Chicago, IL 60643.

    This property is off market, which means it's not currently listed for sale or rent on Zillow. This may be different from what's available on other websites or public sources.

    Facts & features

    Property

    Lot
    • Size: 10,300 sqft
    Details
    • Parcel number: 2519304009

    Construction

    Type & style
    • Home type: SingleFamily
    Condition
    • Year built: 1920

    Community & neighborhood

    Location
    • Region: Chicago

    Price history

    Price history is unavailable.

    Public tax history

    YearProperty taxesTax assessment
    2024-- $12,380 +26.2%
    2023$2,074 +2.5%$9,806
    2022$2,023 +2.3%$9,806
    2021$1,977 -9.8%$9,806 -0.2%
    2020$2,193 +10.9%$9,821
    2019$1,978 +1.7%$9,821
    2018$1,945 +2.5%$9,821 +11.7%
    2017$1,897 +7.5%$8,791
    2016$1,765 +9.3%$8,791
    2015$1,615 +4.9%$8,791 +6.2%
    2014$1,539 +2%$8,276
    2013$1,509 +1.4%$8,276
    2012$1,488 -11.3%$8,276 -19.9%
    2011$1,679 -0.4%$10,336
    2010$1,685 +4.4%$10,336
    2009$1,615 +93.4%$10,336 +77.9%
    2008$835 +1.1%$5,810
    2007$826 -1.1%$5,810
    2006$835 +7.7%$5,810 +22.6%
    2005$776 +1%$4,739
    2004$768 +2.2%$4,739
    2003$751 -11.9%$4,739
    2002$853 +3.7%$4,739
    2001$822 +0%$4,739
    2000$822 $4,739 +11%
    1999-- $4,271

    Find assessor info on the county website

    Neighborhood: Morgan Park

    Nearby schools

    GreatSchools rating
    Get a cash offer in 3 minutes
    Find out how much your home could sell for in as little as 3 minutes with a no-obligation cash offer.
    Estimated market value
    $228,500
    Get a cash offer in 3 minutes
    Find out how much your home could sell for in as little as 3 minutes with a no-obligation cash offer.
    Estimated market value
    $228,500