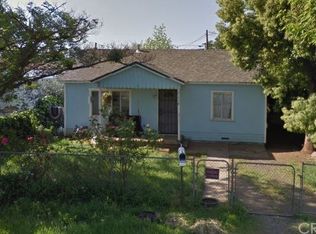
This one is suited for everyone! Investors, builders, land bankers, and families alike! Whether you want to build a home, or just looking for a potential investment…you should go and check this one out. Utilities are conveniently located and available at the street, and the flat land makes it the perfect canvas for your plans! A few scattered trees also add a little charm to your otherwise blank slate. Located on the corner with an alley on one side, means no neighbors on 3 sides! A quick drive through the area will give you a good idea on how quickly the neighborhood is evolving! Opportunities like this don't come along often. Don’t wait until it's too late!
For sale by owner
$25,555
2183 Fort Wayne St, Oroville, CA 95966
--beds
0baths
4,791Square Feet
VacantLand
Built in 1900
4,791 Square Feet Lot
$-- Zestimate®
$--/sqft
$-- HOA
What's special
Flat land
- 55 days
- 83
- 5
Listed by:
Property Owner (530) 487-4003
Estimated market value
Not available
Estimated sales range
Not available
Not available
Price history
| Date | Event | Price |
|---|---|---|
| 9/11/2026 | Listed for sale | $25,555-35.3% |
Source: Owner Report a problem | ||
| 10/1/2025 | Listing removed | $39,500 |
Source:  SDMLS #PA25067426 Report a problem | ||
| 6/23/2025 | Listed for sale | $39,500+414.7% |
Source: SDMLS #PA25067426 Report a problem | ||
| 4/2/2025 | Sold | $7,675-80.6% |
Source: Public Record Report a problem | ||
| 3/28/2025 | Listed for sale | $39,500+414.7% |
Source: MetroList Services of CA #225037860 Report a problem | ||
| 7/10/2024 | Sold | $7,675 |
Source: Public Record Report a problem | ||
Public tax history
| Year | Property taxes | Tax assessment |
|---|---|---|
| 2026 | -- | $25,500 +2% |
| 2025 | $273 +1107.6% | $25,000 +421.8% |
| 2024 | $23 -79% | $4,791 +2% |
| 2023 | $108 -44.2% | $4,698 +2% |
| 2022 | $193 -30.9% | $4,606 +2% |
| 2021 | $280 +101.3% | $4,516 +1% |
| 2020 | $139 +0.8% | $4,470 +2% |
| 2019 | $138 -0.6% | $4,383 +2% |
| 2018 | $139 -1.1% | $4,298 +2% |
| 2017 | $140 +0.2% | $4,214 +2% |
| 2016 | $140 +0.7% | $4,132 +1.5% |
| 2015 | $139 | $4,070 +2% |
| 2014 | $139 | $3,991 +0.5% |
| 2013 | -- | $3,973 +2% |
| 2012 | -- | $3,896 +2% |
| 2011 | -- | $3,820 +0.7% |
| 2010 | -- | $3,792 -0.2% |
| 2009 | -- | $3,801 +2% |
| 2008 | -- | $3,727 +2% |
| 2007 | -- | $3,654 +2% |
| 2006 | -- | $3,583 +2% |
| 2005 | -- | $3,513 +2% |
| 2004 | -- | $3,445 +1.9% |
| 2003 | -- | $3,382 +2% |
| 2002 | -- | $3,316 +2% |
| 2001 | -- | $3,251 |
Find assessor info on the county website
Monthly payment
Est. payment
Payment breakdown
Explore the cost of this home by adjusting the details. Changes won't be saved.Climate risks
Neighborhood: 95966
Similar homes
- $18,0004,791 sqft1835 Elgin, Oroville, CA 95966Lot/Land
 MLS ID #OR26123138, Colesha Farris. eXp Realty
- $18,0004,792 sqft1835 Elgin St Lot 46, Oroville, CA 95966Lot/LandMLS ID #OR26123138, Colesha Farris, eXp Realty of California Inc. CRMLS
- $27,0000.27 acres0 Lower Wyandotte Rd Lot 4, Oroville, CA 95966Lot/Land
 MLS ID #TR26224567, Jonathan Minerick, Homecoin.com. CRMLS
- $23,0006,969 sqftBrookdale 40 Ct, Oroville, CA 95966Lot/Land
 MLS ID #226130626, Valeriia Meronov. MetroList Services of CA
Local buyer's agents are ready to help
