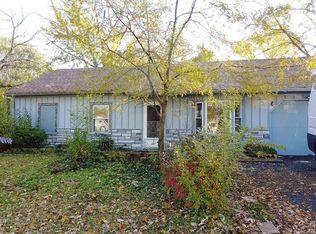
This is a 962 square foot, vacant land. This home is located at 22225 Belmont Rd, Richton Park, IL 60471.
Foreclosed
Est. $141,500
22225 Belmont Rd, Richton Park, IL 60471
3beds
0baths
9,147Square Feet
VacantLand
Built in 1975
9,147 Square Feet Lot
$141,500 Zestimate®
$147/sqft
$-- HOA
Overview
- 540 days |
- 1 |
- 1 |
Facts & features
Interior
Bedrooms & bathrooms
- Bedrooms: 3
- Bathrooms: 0
Heating
- Forced air, Gas
Cooling
- None
Features
- Basement: Finished
Interior area
- Total interior livable area: 962 sqft
Property
Parking
- Parking features: Garage - Attached
Features
- Exterior features: Wood
Lot
- Size: 9,147 Square Feet
Details
- Parcel number: 3127307030
Community & HOA
Location
- Region: Richton Park
Financial & listing details
- Price per square foot: $147/sqft
- Tax assessed value: $140,010
Visit our professional directory to find a foreclosure specialist in your area that can help with your home search.
Find a foreclosure agentForeclosure details
Estimated market value
$141,500
$105,000 - $180,000
$1,729/mo
Price history
| Date | Event | Price |
|---|---|---|
| 6/15/2016 | Listing removed | -- |
Source: Auction.com Report a problem | ||
| 4/29/2016 | Price change | $500-99.3%$1/sqft |
Source: Auction.com Report a problem | ||
| 4/21/2016 | Listed for sale | -- |
Source: Auction.com Report a problem | ||
| 3/21/1995 | Sold | $71,000$74/sqft |
Source: Public Record Report a problem | ||
Public tax history
| Year | Property taxes | Tax assessment |
|---|---|---|
| 2024 | -- | $14,001 +0% |
| 2023 | $4,554 +25.6% | $13,999 +43.2% |
| 2022 | $3,625 -0.8% | $9,775 |
| 2021 | $3,654 +3.7% | $9,775 |
| 2020 | $3,523 -3.4% | $9,775 -5.6% |
| 2019 | $3,648 +0.1% | $10,356 |
| 2018 | $3,643 +2.5% | $10,356 |
| 2017 | $3,554 +2.6% | $10,356 +11.3% |
| 2016 | $3,464 +3.1% | $9,302 |
| 2015 | $3,359 +0.9% | $9,302 |
| 2014 | $3,329 +1.3% | $9,302 -6.4% |
| 2013 | $3,287 +3.4% | $9,938 |
| 2012 | $3,177 +2% | $9,938 |
| 2011 | $3,115 -9.3% | $9,938 -18% |
| 2010 | $3,435 +12.5% | $12,117 |
| 2009 | $3,053 +7.8% | $12,117 -5% |
| 2008 | $2,832 +2.5% | $12,755 +6.4% |
| 2007 | $2,762 +6.7% | $11,988 |
| 2006 | $2,588 +8.3% | $11,988 |
| 2005 | $2,390 -4.8% | $11,988 +15.1% |
| 2004 | $2,510 +4.7% | $10,411 |
| 2003 | $2,398 +2.8% | $10,411 |
| 2002 | $2,333 -1.9% | $10,411 +17.2% |
| 2001 | $2,378 +1.6% | $8,880 |
| 2000 | $2,342 +41.3% | $8,880 |
| 1999 | $1,657 | $8,880 |
Find assessor info on the county website
Monthly payment
Estimated monthly payment$1,822
All calculations are estimates and provided by Zillow, Inc. for informational purposes only. Actual amounts may vary.
HOA fees may include property taxes on listings classified as Co-Ops. Contact the listing agent and/or owner for fee details.
Mortgage interest rates are dependent on a number of factors, including credit score, down payment, and repayment length. Interest rate data provided by Zillow Group Marketplace, Inc. as of 1/1/1970 from various mortgage lenders with which we have lead or other similar arrangements; the Estimated Payment is an average of those rates.
See how much you could borrow to make a competitive offer.
Climate risks
Neighborhood: 60471
Nearby schools
GreatSchools rating
- 5/10Sauk Elementary SchoolGrades: 4-6Distance: 0.3 mi
- 5/10O W Huth Middle SchoolGrades: 7-8Distance: 1.7 mi
- 6/10Rich Township High SchoolGrades: 9-12Distance: 2.9 mi


- Illinois
- Cook County
- Richton Park
- 60471
- 22225 Belmont Rd
Nearby cities
Nearby zip codes
Other Richton Park Topics
