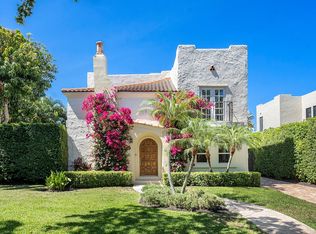
Furnished Off Season Lease in West Palm Beach. Off-Season - $5,500
This property is off market, which means it's not currently listed for sale or rent on Zillow. This may be different from what's available on other websites or public sources.
$3,590,000
$3.16M - $4.13M
$7,667/mo
$7,667/mo
Rent Zestimate®
Find your next renter with Zillow Rental Manager. Plus, with online applications, you can quickly screen prospective tenants – for free.
$7,667/mo
Rent Zestimate®
$24,400/mo
Est. payment
Refinancing to a lower rate could help reduce your monthly payments and save thousands over the life of the loan.
$24,400/mo
Est. payment
Work with a Zillow partner agent
Leverage their expertise and Zillow's premium Showcase listings to get your home seen by more buyers.
Get startedList with your own agent
Get your home in front of millions of buyers by listing it on Zillow.
Learn how to do itSell it yourself
Take full control of how buyers see your home on Zillow by listing For Sale by Owner (FSBO).
List your homeFurnished Off Season Lease in West Palm Beach. Off-Season - $5,500
This property is off market, which means it's not currently listed for sale or rent on Zillow. This may be different from what's available on other websites or public sources.
| Date | Event | Price |
|---|---|---|
| 6/25/2024 | Listing removed | -- |
Source: | ||
| 6/24/2021 | Sold | $2,225,000+1.1%$926/sqft |
Source: Palm Beach BOR #21-669 Report a problem | ||
| 4/23/2021 | Pending sale | $2,200,000$916/sqft |
Source: | ||
| 4/22/2021 | Listed for sale | $2,200,000+74.6%$916/sqft |
Source: | ||
| 6/26/2018 | Listing removed | $5,500$2/sqft |
Source: Sotheby's International Realty - Palm Beach Brokerage #18-1021 Report a problem | ||
| 5/11/2018 | Listed for rent | $5,500$2/sqft |
Source: Sotheby's International Realty - Palm Beach Brokerage #18-1021 Report a problem | ||
| 11/10/2017 | Sold | $1,260,000-3%$525/sqft |
Source: | ||
| 8/30/2017 | Pending sale | $1,299,000$541/sqft |
Source: Sotheby's International Realty - Palm Beach Brokerage #17-522 Report a problem | ||
| 7/26/2017 | Price change | $1,299,000-6.2%$541/sqft |
Source: Sotheby's International Realty - Palm Beach Brokerage #17-522 Report a problem | ||
| 5/10/2017 | Price change | $1,385,000-4.4%$577/sqft |
Source: Sotheby's International Realty - Palm Beach Brokerage #17-522 Report a problem | ||
| 2/27/2017 | Listed for sale | $1,449,000+34.8%$603/sqft |
Source: Sotheby's International Realty #RX-10311909 Report a problem | ||
| 5/15/2015 | Sold | $1,075,000+61.7%$448/sqft |
Source: Public Record Report a problem | ||
| 6/7/2011 | Sold | $665,000-4.9%$277/sqft |
Source: Public Record Report a problem | ||
| 12/31/2010 | Listed for sale | $699,000-29.7%$291/sqft |
Source: Fite Shavell & Associates #R3163719 Report a problem | ||
| 9/2/2010 | Listing removed | $995,000$414/sqft |
Source: Illustrated Properties Real Estate #R3090060 Report a problem | ||
| 5/1/2010 | Price change | $995,000+10.7%$414/sqft |
Source: Illustrated Properties Real Estate #R3090060 Report a problem | ||
| 2/28/2010 | Price change | $899,000-10%$374/sqft |
Source: Illustrated Properties Real Estate #R3090060 Report a problem | ||
| 7/3/2009 | Price change | $999,000-9.2%$416/sqft |
Source: Illustrated Properties Real Estate #R3032013 Report a problem | ||
| 10/28/2008 | Price change | $1,100,000-15.4%$458/sqft |
Source: Corcoran #08-2503 Report a problem | ||
| 9/12/2008 | Listed for sale | $1,300,000+136.4%$541/sqft |
Source: Corcoran #R2844293 Report a problem | ||
| 10/19/2000 | Sold | $550,000+64.2%$229/sqft |
Source: Public Record Report a problem | ||
| 6/9/1999 | Sold | $335,000$139/sqft |
Source: Public Record Report a problem | ||
| Year | Property taxes | Tax assessment |
|---|---|---|
| 2025 | $50,357 +5.6% | $2,432,997 +5.6% |
| 2024 | $47,709 +4.2% | $2,303,836 +9.5% |
| 2023 | $45,794 +12% | $2,103,596 +10% |
| 2022 | $40,879 +80.6% | $1,912,360 +75.7% |
| 2021 | $22,630 +0.5% | $1,088,503 +1.4% |
| 2020 | $22,526 +0.2% | $1,073,474 +1.1% |
| 2019 | $22,487 | $1,061,899 +23% |
| 2018 | $22,487 +21.9% | $863,112 -13.9% |
| 2017 | $18,443 -15.1% | $1,002,366 +8.8% |
| 2016 | $21,712 +6.6% | $920,959 +50.8% |
| 2015 | $20,360 +47.9% | $610,731 +10% |
| 2014 | $13,765 +30.4% | $555,210 +21% |
| 2012 | $10,559 +22.2% | $458,851 +22.5% |
| 2011 | $8,641 +10.3% | $374,654 -0.6% |
| 2010 | $7,836 -10.7% | $376,835 -11.7% |
| 2009 | $8,773 -19.7% | $426,923 -24.5% |
| 2008 | $10,925 +2.5% | $565,125 +3% |
| 2007 | $10,657 -0.9% | $548,665 +13.2% |
| 2006 | $10,759 +59.2% | $484,631 +3.8% |
| 2004 | $6,757 +3148.8% | $467,000 |
| 2003 | $208 -98.3% | $467,000 |
| 2001 | $11,905 +61.8% | $467,000 +63.9% |
| 2000 | $7,358 +150.4% | $285,000 +50.9% |
| 1999 | $2,939 | $188,827 |
Find assessor info on the county website