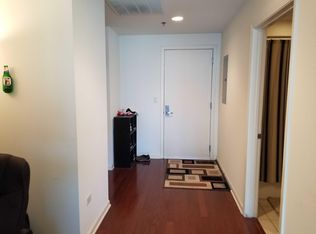
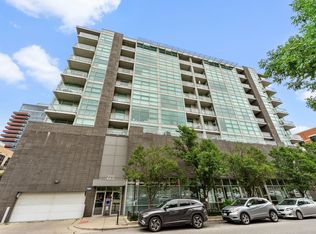
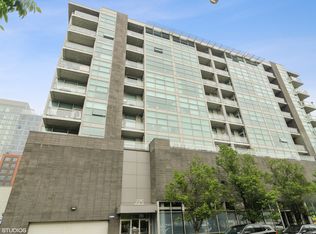
This is a condo home. This home is located at 225 S Sangamon St Unit 403, Chicago, IL 60607.
This property is not currently displayed as for sale or rent on Zillow. This may be different from what's on other websites or public sources.
$493,100
$464,000 - $523,000
$3,089/mo
$3,089/mo
Rent Zestimate®
Find your next renter with Zillow Rental Manager. Plus, with online applications, you can quickly screen prospective tenants – for free.
$3,089/mo
Rent Zestimate®
$4,214/mo
Est. payment
Refinancing to a lower rate could help reduce your monthly payments and save thousands over the life of the loan.
$4,214/mo
Est. payment
Work with a Zillow partner agent
Leverage their expertise and Zillow's premium Showcase listings to get your home seen by more buyers.
Get startedList with your own agent
Get your home in front of millions of buyers by listing it on Zillow.
Learn how to do itSell it yourself
Take full control of how buyers see your home on Zillow by listing For Sale by Owner (FSBO).
List your homeThis is a condo home. This home is located at 225 S Sangamon St Unit 403, Chicago, IL 60607.
This property is not currently displayed as for sale or rent on Zillow. This may be different from what's on other websites or public sources.
| Date | Event | Price |
|---|---|---|
| 7/2/2021 | Sold | $490,000+53.1% |
Source: @Properties sold #10978521_60607_306 Report a problem | ||
| 5/28/2021 | Sold | $320,000-23.8% |
Source: @Properties sold #11011702_60607_502 Report a problem | ||
| 10/9/2020 | Sold | $420,000+18.3% |
Source: @Properties sold #10822684_60607_809 Report a problem | ||
| 7/28/2020 | Sold | $355,000-31.7% |
Source: @Properties sold #10734089_60607_302 Report a problem | ||
| 3/9/2020 | Sold | $520,000+7.2% |
Source: @Properties sold #10615630_60607_907 Report a problem | ||
| 10/4/2019 | Sold | $485,000+19.8% |
Source: @Properties sold #10458864_60607_506 Report a problem | ||
| 5/22/2019 | Sold | $405,000+11% |
Source: Baird & Warnerc #10310394_60607_909 Report a problem | ||
| 2/20/2018 | Sold | $365,000-27.7% |
Source: @Properties sold #09830100_60607 Report a problem | ||
| 8/21/2017 | Sold | $505,000+46.2% |
Source: @Properties sold #09685979_60607 Report a problem | ||
| 5/2/2017 | Sold | $345,500-19.3% |
Source: @Properties sold #09565275_60607 Report a problem | ||
| 11/9/2016 | Sold | $428,000-3.8% |
Source: Berkshire Hathaway HomeServices Koenig Rubloff #09355937_60607_512 Report a problem | ||
| 9/26/2016 | Sold | $445,000+12.4% |
Source: @Properties sold #09286555_60607 Report a problem | ||
| 4/15/2016 | Sold | $396,000+25.7% |
Source: Berkshire Hathaway HomeServices Koenig Rubloff #09154840_60607_810 Report a problem | ||
| 7/30/2015 | Sold | $315,000-29.2% |
Source: Berkshire Hathaway HomeServices Koenig Rubloff #08957072_60607 Report a problem | ||
| 7/21/2014 | Sold | $445,000+27.3% |
Source: Berkshire Hathaway HomeServices Koenig Rubloff #08583755_60607_901 Report a problem | ||
| 6/19/2014 | Sold | $349,500+9.2% |
Source: Baird & Warnerc #08577834_60607_608 Report a problem | ||
| 7/11/2011 | Sold | $320,000+23.1% |
Source: @Properties sold #07791902_60607 Report a problem | ||
| 2/9/2011 | Sold | $260,000-26.8% |
Source: Berkshire Hathaway HomeServices Koenig Rubloff #07575967_60607_902 Report a problem | ||
| 11/2/2010 | Sold | $355,000+35.2% |
Source: Berkshire Hathaway HomeServices Koenig Rubloff #07517936_60607_801 Report a problem | ||
| 6/4/2010 | Sold | $262,500-8.4% |
Source: Berkshire Hathaway HomeServices Koenig Rubloff #07534195_60607_803 Report a problem | ||
| 3/19/2010 | Sold | $286,500-19.6% |
Source: Berkshire Hathaway HomeServices Koenig Rubloff #07311187_60607_808 Report a problem | ||
| 1/25/2008 | Sold | $356,500 |
Source: @Properties sold #06783094_60607 Report a problem | ||
| Year | Property taxes | Tax assessment |
|---|---|---|
| 2024 | $6,156 -5.3% | $30,530 -0.5% |
| 2023 | $6,498 +2.6% | $30,691 |
| 2022 | $6,334 -5.4% | $30,691 -7.5% |
| 2021 | $6,694 +24.8% | $33,179 +38.2% |
| 2020 | $5,364 +1.3% | $24,001 -8.6% |
| 2019 | $5,295 +1.7% | $26,268 |
| 2018 | $5,206 +8.5% | $26,268 +18.3% |
| 2017 | $4,797 +7.8% | $22,205 |
| 2016 | $4,447 +9.3% | $22,205 |
| 2015 | $4,069 +4.8% | $22,205 +6.1% |
| 2014 | $3,882 +2% | $20,923 |
| 2013 | $3,805 +1.4% | $20,923 |
| 2012 | $3,755 | $20,923 |