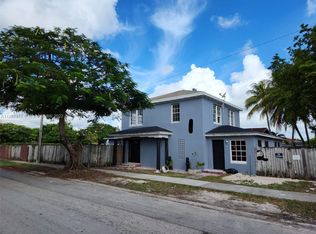
Income-producing multifamily opportunity in Miami! This duplex features a spacious main residence with 4 bedrooms and 3.5 bathrooms, plus a separate 1 bedroom, 1 bathroom unit currently rented for $2,300 per month. The main home has rental potential of over $4,750 per month, offering strong cash-flow upside. In addition, the property includes a rentable RV setup and two boat lease spaces that generate additional monthly income. Per owner, the property is currently producing $7,900 per month in total income. A great opportunity for investors or owner-occupants looking to live in one unit while generating income from the others. Conveniently located
For sale
$779,000
2275 NW 30th St, Miami, FL 33142
--beds
--baths
2,190sqft
Duplex
Built in 1935
-- sqft lot
$747,100 Zestimate®
$356/sqft
$-- HOA
What's special
Rentable rv setupTwo boat lease spaces
- 35 days |
- 121 |
- 4 |
Likely to sell faster than
Zillow last checked:
Listing updated:
Listed by:
John Mena 305-903-9158,
Modern World Realty
Source: MIAMI,MLS#: A12026405 Originating MLS: A-Miami Association of REALTORS
Loading...
Facts & features
Interior
Heating
- Other
Cooling
- Central Air
Features
- Flooring: Ceramic Tile, Tile
Interior area
- Total structure area: 2,262
- Total interior livable area: 2,190 sqft
Video & virtual tour
Property
Parking
- Total spaces: 4
Features
- Stories: 2
Lot
- Features: Less Than 1/4 Acre Lot
Details
- Parcel number: 0131270270120
- Zoning: 5700
Construction
Type & style
- Home type: MultiFamily
- Property subtype: Duplex
Materials
- CBS Construction
- Roof: Shingle
Condition
- Year built: 1935
Utilities & green energy
- Sewer: Public Sewer
Community & HOA
Community
- Subdivision: Glenhaven
HOA
- Has HOA: No
Location
- Region: Miami
Financial & listing details
- Price per square foot: $356/sqft
- Tax assessed value: $530,098
- Annual tax amount: $10,901
- Date on market: 5/27/2026
- Listing terms: All Cash,Conventional,FHA,VA Loan
Estimated market value
$747,100
$710,000 - $784,000
$2,418/mo
Price history
| Date | Event | Price |
|---|---|---|
| 5/27/2026 | Listed for sale | $779,000-2.6%$356/sqft |
Source: | ||
| 4/9/2026 | Listing removed | $799,999$365/sqft |
Source: | ||
| 2/18/2026 | Price change | $799,999-0.6%$365/sqft |
Source: | ||
| 11/19/2025 | Listed for sale | $805,000+12.6%$368/sqft |
Source: | ||
| 4/7/2025 | Price change | $1,350-10%$1/sqft |
Source: | ||
| 2/8/2025 | Price change | $1,500-9.1%$1/sqft |
Source: | ||
| 7/26/2024 | Price change | $1,650+24.5%$1/sqft |
Source: | ||
| 7/3/2024 | Listed for rent | $1,325+10.4%$1/sqft |
Source: | ||
| 8/15/2023 | Listing removed | -- |
Source: | ||
| 6/29/2023 | Price change | $1,200-14.3%$1/sqft |
Source: | ||
| 6/19/2023 | Price change | $1,400-3.4%$1/sqft |
Source: | ||
| 6/9/2023 | Listed for rent | $1,450-39.5%$1/sqft |
Source: | ||
| 6/8/2023 | Sold | $715,000-1.4%$326/sqft |
Source: | ||
| 6/1/2023 | Contingent | $725,000$331/sqft |
Source: | ||
| 5/4/2023 | Pending sale | $725,000$331/sqft |
Source: | ||
| 4/5/2023 | Price change | $725,000-2%$331/sqft |
Source: | ||
| 3/24/2023 | Price change | $740,000-4.5%$338/sqft |
Source: | ||
| 1/30/2023 | Listed for sale | $775,000-22.4%$354/sqft |
Source: | ||
| 12/21/2022 | Listing removed | -- |
Source: | ||
| 12/9/2022 | Listed for sale | $999,000$456/sqft |
Source: | ||
| 11/28/2022 | Listing removed | -- |
Source: | ||
| 11/17/2022 | Price change | $999,000-23.2%$456/sqft |
Source: | ||
| 10/28/2022 | Listed for sale | $1,300,000+246.7%$594/sqft |
Source: | ||
| 10/16/2022 | Listing removed | -- |
Source: Zillow Rental Manager Report a problem | ||
| 9/15/2022 | Listed for rent | $2,395$1/sqft |
Source: Zillow Rental Manager Report a problem | ||
| 2/16/2022 | Sold | $375,000$171/sqft |
Source: | ||
Public tax history
| Year | Property taxes | Tax assessment |
|---|---|---|
| 2025 | $11,355 +4.2% | $530,098 +4.8% |
| 2024 | $10,896 +32.7% | $505,942 +39.6% |
| 2023 | $8,212 +182.9% | $362,495 +241.3% |
| 2022 | $2,903 +7.2% | $106,206 +7.7% |
| 2021 | $2,707 +20.7% | $98,656 +7% |
| 2020 | $2,243 +10.1% | $92,238 +7.1% |
| 2019 | $2,037 +8.6% | $86,085 +6.9% |
| 2018 | $1,876 | $80,564 +6.8% |
| 2017 | $1,876 +13.8% | $75,442 +6.6% |
| 2016 | $1,648 +7.8% | $70,740 +5.9% |
| 2015 | $1,529 +2.5% | $66,830 +5.7% |
| 2014 | $1,493 +7.9% | $63,229 +5.9% |
| 2013 | $1,383 | $59,733 +4.2% |
| 2012 | $1,383 -8.9% | $57,298 -22.2% |
| 2011 | $1,518 -10.5% | $73,680 -8.1% |
| 2010 | $1,697 -38.3% | $80,195 -38% |
| 2009 | $2,752 -20.5% | $129,256 +1.8% |
| 2007 | $3,463 +22.5% | $126,958 |
| 2006 | $2,828 | -- |
| 2005 | $2,828 +4% | -- |
| 2004 | $2,719 +26.9% | -- |
| 2003 | $2,143 +9.6% | -- |
| 2002 | $1,954 | -- |
| 2001 | $1,954 | -- |
Find assessor info on the county website
Monthly payment
Est. payment$--/mo
Payment breakdown
Explore the cost of this home by adjusting the details. Changes won't be saved.All calculations are estimates and provided by Zillow, Inc. for informational purposes only. Actual amounts may vary.
HOA fees may include property taxes on listings classified as Co-Ops. Contact the listing agent and/or owner for fee details.
Mortgage interest rates are dependent on a number of factors, including credit score, down payment, and repayment length. Interest rate data provided by Zillow Group Marketplace, Inc. as of 1/1/1970 from various mortgage lenders with which we have lead or other similar arrangements; the Estimated Payment is an average of those rates.
See how much you could borrow to make a competitive offer.
Climate risks
Neighborhood: Allapattah
Nearby schools
GreatSchools rating
- 4/10Maya Angelou Elementary SchoolGrades: PK-5Distance: 0.4 mi
- 3/10Brownsville Middle SchoolGrades: 6-8Distance: 1.1 mi
- 4/10Miami Jackson Senior High SchoolGrades: 9-12Distance: 0.7 mi
A local agent can set up tours, give advice and negotiate with sellers.


- Florida
- Miami-Dade County
- Miami
- 33142
- Allapattah
- 2275 NW 30th St
Nearby cities
Nearby neighborhoods
Nearby zip codes
Other Miami Topics
