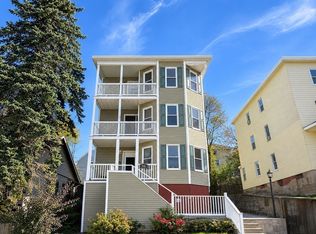
Come check out this well maintained in Kelly sq, beautifully renovated 3-family. Close to major routs 146, I 190, 290 , 122 , I 90 Mass pike , Rt 9, Rt 20 and 395. Unit 1 is Lead Certified. Recent updates including Back and front porches , basement, painted all 3 units, installed new heat system in Unit #3 and replaced new window. Hardwood floor in all 3 units. Gross income $6100 a month. Property currently vacant, easy to show near Union sq. ( Central Bus & Train station). Prime opportunity for both investors and owner- occupants looking to benefit from strong rental potential in a convenient Worcester location Near Polar park and all public transportation, shopping, dining, and local amenities. The Property consists of three-levels with a total 9 bedrooms and 3 full bathrooms, separate living, dining and kitchen. Laundry hookup in the each unit.
For sale
$699,000
23 Jefferson St, Worcester, MA 01604
9beds
3,892sqft
3 Family
Built in 1890
-- sqft lot
$687,000 Zestimate®
$180/sqft
$-- HOA
What's special
Replaced new windowBack and front porches
- 11 days
- 290
- 20
Zillow last checked:
Listing updated:
Listed by:
Sohrab Khan 617-678-6843,
MIG 617-651-5406
Source: MLS PIN,MLS#: 73599206
Facts & features
Interior
Bedrooms & bathrooms
- Bedrooms: 9
- Bathrooms: 3
- Full bathrooms: 3
Features
- Basement: Unfinished
- Has fireplace: No
Interior area
- Total structure area: 3,892
- Total interior livable area: 3,892 sqft
- Finished area above ground: 3,892
Property
Parking
- Total spaces: 3
- Parking features: Paved Drive
- Uncovered spaces: 3
Lot
- Size: 2,950 Square Feet
- Features: Other
Details
- Foundation area: 0
- Parcel number: M:0004 B:0036 L:00006,1765452
- Zoning: RG-5
Construction
Type & style
- Home type: MultiFamily
- Property subtype: 3 Family
Materials
- Foundation: Concrete Perimeter
Condition
- Year built: 1890
Utilities & green energy
- Sewer: Public Sewer
- Water: Public
Community & HOA
Location
- Region: Worcester
Financial & listing details
- Price per square foot: $180/sqft
- Tax assessed value: $566,800
- Annual tax amount: $7,527
- Date on market: 11/5/2026
- Total actual rent: 6100
Estimated market value
$687,000
$653,000 - $721,000
$2,093/mo
Price history
| Date | Event | Price |
|---|---|---|
| 11/5/2026 | Listed for sale | $699,000+72.6%$180/sqft |
Source: MLS PIN #73599206 Report a problem | ||
| 2/25/2021 | Sold | $405,000-9.8%$104/sqft |
Source: Public Record Report a problem | ||
| 11/24/2020 | Pending sale | $449,000$115/sqft |
Source: RE/MAX Prof Associates #72753840 Report a problem | ||
| 11/6/2020 | Listed for sale | $449,000+38.2%$115/sqft |
Source: RE/MAX Prof Associates #72753840 Report a problem | ||
| 2/6/2019 | Listing removed | $325,000$84/sqft |
Source: RE/MAX PROFESSIONAL ASSOCIATES #72358753 Report a problem | ||
| 7/30/2018 | Pending sale | $325,000$84/sqft |
Source: RE/MAX PROFESSIONAL ASSOCIATES #72358753 Report a problem | ||
| 7/9/2018 | Listed for sale | $325,000+364.3%$84/sqft |
Source: RE/MAX Prof Associates #72358753 Report a problem | ||
| 10/3/2008 | Sold | $70,000-12.4%$18/sqft |
Source: Public Record Report a problem | ||
| 7/31/2008 | Price change | $79,900-20%$21/sqft |
Source: MLS Property Information Network #70758346 Report a problem | ||
| 6/20/2008 | Price change | $99,900-16.7%$26/sqft |
Source: MLS Property Information Network #70758346 Report a problem | ||
| 5/28/2008 | Listed for sale | $119,900-2.7%$31/sqft |
Source: MLS Property Information Network #70758346 Report a problem | ||
| 4/17/2008 | Sold | $123,250-12.6%$32/sqft |
Source: Public Record Report a problem | ||
| 8/27/2001 | Sold | $141,000+58.4%$36/sqft |
Source: Public Record Report a problem | ||
| 6/18/1999 | Sold | $89,000+48.3%$23/sqft |
Source: Public Record Report a problem | ||
| 10/20/1994 | Sold | $60,000$15/sqft |
Source: Public Record Report a problem | ||
Public tax history
| Year | Property taxes | Tax assessment |
|---|---|---|
| 2025 | $7,323 +9.6% | $555,200 +14.2% |
| 2024 | $6,683 +4.6% | $486,000 +9.1% |
| 2023 | $6,387 -3.2% | $445,400 +2.7% |
| 2022 | $6,597 +12.8% | $433,700 +20.8% |
| 2021 | $5,846 +35.2% | $359,100 +41.2% |
| 2020 | $4,323 -1.5% | $254,300 +4.3% |
| 2019 | $4,387 +3% | $243,700 +8.2% |
| 2018 | $4,260 +7.5% | $225,300 +9.3% |
| 2017 | $3,963 +1.3% | $206,200 +8.6% |
| 2016 | $3,914 +2.7% | $189,900 |
| 2015 | $3,811 +2.7% | $189,900 |
| 2014 | $3,711 +5.8% | $189,900 +0.6% |
| 2013 | $3,508 +5.9% | $188,800 -3.3% |
| 2012 | $3,314 +15.1% | $195,200 +2.7% |
| 2010 | $2,879 -14.2% | $190,000 -23.5% |
| 2009 | $3,355 -8.3% | $248,500 -14.8% |
| 2008 | $3,659 +5.9% | $291,800 +2.2% |
| 2007 | $3,456 +2% | $285,600 +5.7% |
| 2006 | $3,387 +6% | $270,300 +11.5% |
| 2005 | $3,195 +25.9% | $242,400 +40.9% |
| 2004 | $2,537 +13.9% | $172,000 +24.8% |
| 2003 | $2,227 +13.9% | $137,800 +25.7% |
| 2002 | $1,956 +29.5% | $109,600 +34% |
| 2000 | $1,511 +27.1% | $81,800 +28.4% |
| 1997 | $1,189 | $63,700 |
Find assessor info on the county website
Monthly payment
Est. payment
Payment breakdown
Explore the cost of this home by adjusting the details. Changes won't be saved.Climate risks
Neighborhood: 01604


Similar homes
- $749,9009 bd3 ba3.9k sqft91 Providence St, Worcester, MA 01604For Sale
 MLS ID #73598997, Matheus Goncalves, Mega Realty Services. MLS PIN
- $644,0006 bd3 ba2.2k sqft12 Puritan Ave, Worcester, MA 01604For Sale
 MLS ID #73585698, Patti Fitzgerald, Coldwell Banker Realty. MLS PIN
- $749,0009 bd4 ba4k sqft212 Vernon St, Worcester, MA 01607For Sale
 MLS ID #73598394, Nghia Nguyen, PRIVI Realty LLC. MLS PIN
- $724,8809 bd6 ba3.1k sqft56 Everard St, Worcester, MA 01605For Sale
 MLS ID #73597334, Fritzie Puverge, My Harvard Apartment. MLS PIN
